Quality Management: Best Books on TQM, Quality Control and Continuous Improvement
This curriculum builds a rigorous, end-to-end mastery of quality management starting from intermediate-level foundations in TQM philosophy, then advancing through statistical process control, ISO standards implementation, and finally the cutting-edge integration of Lean, Six Sigma, and continuous improvement strategy. Each stage deepens both conceptual understanding and practical tooling, so that earlier books supply the mental models and vocabulary needed to fully exploit the later, more technical ones.
TQM Philosophy & Foundational Thinking
IntermediateUnderstand the core philosophy of Total Quality Management — its history, key thinkers, and the cultural/organizational principles that underpin all quality systems.
▸ Study plan for this stage
Pace: 8–10 weeks, ~40–50 pages/day. Deming (4 weeks), Juran (3 weeks), Goldratt (2–3 weeks). Allocate extra time for Deming's dense philosophical sections and Goldratt's narrative case study.
- Deming's 14 Points and System of Profound Knowledge as the philosophical foundation of continuous improvement and elimination of waste
- The distinction between common cause and special cause variation, and why inspection-based quality control fails
- Juran's Quality Trilogy (Planning, Control, Improvement) and the Pareto Principle (vital few vs. trivial many) as frameworks for organizational quality
- The role of management responsibility and cultural transformation in TQM—moving from blame to system thinking
- Theory of Constraints (TOC) and the concept of the bottleneck as a systems-level approach to identifying and breaking constraints
- The integration of statistical thinking, process thinking, and human psychology in quality management
- How organizational culture, leadership commitment, and employee engagement are prerequisites for sustainable quality improvement
- What are Deming's 14 Points, and why does he argue that traditional management practices (e.g., numerical targets, merit ratings) actually harm quality and productivity?
- Explain the difference between common cause and special cause variation. Why is tampering with a stable process counterproductive?
- What is Juran's Quality Trilogy, and how do the three stages (Planning, Control, Improvement) differ in their objectives and methods?
- How does the Pareto Principle apply to quality improvement, and what does Juran mean by the 'vital few' versus 'trivial many'?
- What is the Theory of Constraints, and how does Goldratt's bottleneck concept challenge traditional approaches to productivity and quality?
- How do Deming, Juran, and Goldratt each address the role of management and organizational culture in enabling quality improvement?
- Create a one-page summary of Deming's 14 Points and map each point to a specific organizational dysfunction (e.g., Point 1 'Constancy of Purpose' addresses short-term thinking). Identify which points are most relevant to your own organization or industry.
- Conduct a variation analysis in a real or hypothetical process: identify 5–10 data points (e.g., customer wait times, defect rates, project delivery times), plot them, and classify observed variations as common cause or special cause. Propose interventions for each type.
- Apply Juran's Quality Trilogy to a current project or process: define the planning phase (standards and goals), control phase (monitoring and corrective action), and improvement phase (breakthrough improvements). Document the activities and metrics for each.
- Perform a Pareto analysis on a real dataset (e.g., customer complaints, defect types, production delays): rank issues by frequency or impact, identify the vital few (typically 20% of causes driving 80% of problems), and propose focused improvement efforts.
- Map a process you know well (e.g., order fulfillment, software development, patient intake) as a system, identify the current bottleneck using Goldratt's thinking, and design a constraint-breaking intervention. Present the before/after impact.
- Interview a manager or team leader about their current quality practices and cultural assumptions. Assess the extent to which their approach aligns with Deming's system thinking versus traditional blame-based management. Write a brief reflection on the gaps.
Next up: This stage establishes the philosophical and systems-thinking foundation that underpins all quality methodologies; the next stage will translate these principles into specific, actionable frameworks and tools (e.g., Six Sigma, Lean, ISO standards) for diagnosing and solving quality problems in practice.
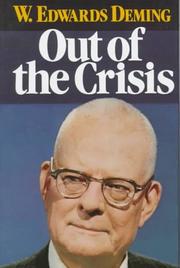
The canonical starting point for any serious quality student. Deming's 14 Points and System of Profound Knowledge define the intellectual DNA of modern quality management; reading this first ensures every subsequent framework is understood in its proper philosophical context.

Complements Deming by introducing the Quality Trilogy (planning, control, improvement) and a structured, managerial lens. Reading it second shows how TQM philosophy translates into organizational roles and processes.

A business novel that builds intuition for systems thinking and constraint management — essential mental models for understanding why quality problems persist. Its narrative format makes abstract concepts concrete before the technical material begins.
Statistical Process Control & Measurement
IntermediateMaster the quantitative tools of quality control — control charts, process capability, variation analysis, and measurement system analysis — so you can detect and diagnose quality problems with data.
▸ Study plan for this stage
Pace: 8–10 weeks, ~40–50 pages/day (Wheeler first: 2–3 weeks; Montgomery second: 5–7 weeks)
- Common cause vs. special cause variation: how to distinguish random process noise from signals of real problems using control limits
- Control charts (X-bar & R, I-MR, p-charts, c-charts): when to use each type and how to interpret patterns, runs, and out-of-control signals
- Process capability indices (Cp, Cpk, Pp, Ppk): how to measure whether a process can meet specifications and what capability gaps mean
- Rational subgrouping and sampling strategy: how to collect data in a way that reveals assignable causes rather than masking them
- Measurement system analysis (MSA/Gage R&R): how to validate that your measurement system is accurate and precise enough for decision-making
- Variation reduction methodology: how to use control charts and capability studies to identify, prioritize, and eliminate sources of variation
- Statistical foundations for quality: normal distribution, standard deviation, hypothesis testing, and confidence intervals applied to process control
- Real-world implementation: how to design, launch, and maintain control charts in production and transactional processes
- What is the difference between common cause and special cause variation, and how do control limits help you detect which one is present?
- When would you use an X-bar & R chart versus an I-MR chart, and what does each point and line on the chart represent?
- How do you interpret a p-chart or c-chart, and what does it mean if points fall outside the control limits?
- What do Cp and Cpk tell you about a process, and why is Cpk more useful than Cp for real decision-making?
- How do you design a rational subgrouping strategy, and why does it matter whether you sample consecutively or randomly?
- What is Gage R&R, how do you conduct it, and what percentage of tolerance or variation is acceptable for your measurement system?
- How do you use a control chart to diagnose the root cause of a process problem, and what patterns should trigger investigation?
- What are the steps to implement statistical process control in a new process, and how do you transition from initial capability study to ongoing monitoring?
- Collect 100+ consecutive measurements from a real or simulated process (e.g., fill weights, cycle times, defect counts); plot them as a time series and identify obvious shifts or trends before calculating control limits
- Calculate control limits for an X-bar & R chart using real data; plot the data and identify out-of-control points; for each, hypothesize a special cause and verify it against process records
- Construct an I-MR chart for individual measurements (e.g., daily batch averages); interpret runs of points above/below the center line and use the moving range to detect process changes
- Build a p-chart for defect proportions or a c-chart for defect counts over 20+ subgroups; identify shifts in quality level and calculate the cost impact of the variation you observe
- Perform a process capability study: collect 25–30 subgroups, calculate Cp, Cpk, Pp, Ppk; compare to specification limits; estimate the percentage of nonconforming output and recommend actions
- Design and execute a Gage R&R study: have 2–3 operators measure 5–10 parts 2–3 times each; analyze repeatability and reproducibility; determine if the measurement system is adequate for your control chart
- Take a published control chart or case study (from Montgomery or Wheeler); re-analyze the data, identify the control limits, interpret the signals, and propose corrective actions
- Simulate a process with known special causes (e.g., a shift in mean, an increase in variation); collect data before and after; use control charts to detect when the change occurred and estimate its magnitude
Next up: This stage equips you with the quantitative diagnostic tools to detect and measure quality problems; the next stage will teach you how to systematically investigate root causes and implement solutions using design of experiments and process improvement methodologies.
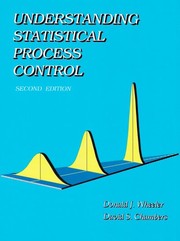
The clearest, most practical introduction to SPC available. Wheeler demystifies control charts and the distinction between common and special cause variation, building the statistical intuition needed before tackling more advanced texts.
The definitive academic and professional reference for SQC, covering control charts, acceptance sampling, process capability, and designed experiments. Reading Wheeler first makes Montgomery's rigor approachable rather than overwhelming.
ISO Standards & Quality Systems
IntermediateUnderstand how quality management is formalized into auditable systems — specifically ISO 9001 and related standards — and how to design, implement, and maintain a compliant quality management system.
▸ Study plan for this stage
Pace: 4–5 weeks, ~25–30 pages/day, with 2–3 days per week dedicated to exercises and reflection
- ISO 9001 core requirements and the Plan-Do-Check-Act (PDCA) cycle as the foundation of quality management systems
- Documentation and record-keeping as evidence of system compliance and continuous improvement
- Process approach to quality management: mapping, controlling, and improving organizational processes
- Auditing and management review mechanisms for maintaining and evolving the QMS
- Risk-based thinking and preventive action to anticipate and eliminate quality failures before they occur
- Customer focus and stakeholder engagement as drivers of quality system design and effectiveness
- Integration of quality tools (control charts, root cause analysis, statistical methods) into systematic QMS operations
- What are the eight quality management principles underlying ISO 9001, and how do they translate into practical system design?
- How does the Plan-Do-Check-Act cycle function as the operational engine of a quality management system, and where does it appear in different organizational processes?
- What documentation and records must a compliant QMS maintain, and why is traceability critical to demonstrating conformity?
- How do you conduct an internal audit to assess QMS effectiveness, and what should you look for to identify improvement opportunities?
- What is the difference between corrective and preventive action, and when should each be deployed in a quality system?
- How does risk-based thinking change the way you design and maintain a quality management system?
- Map a core process in your organization (e.g., order fulfillment, product design, customer service) using the PDCA framework, identifying Plan, Do, Check, and Act phases with specific controls and metrics
- Create a quality manual outline for a fictional or real organization, including scope, policy statements, and references to key procedures required by ISO 9001
- Design a simple internal audit checklist for one functional area (e.g., document control, supplier management, nonconforming product handling) based on ISO 9001 requirements
- Conduct a mock internal audit of a process using your checklist, document findings, and draft corrective action requests with root cause analysis
- Develop a risk register for a specific business process, identify top risks, and design preventive controls or mitigation strategies
- Analyze a real quality incident (case study or hypothetical) and trace it through the corrective action process: detection → investigation → root cause → action → verification → closure
Next up: This stage equips you with the formalized language, structure, and auditable requirements of ISO 9001, preparing you to advance to implementation and sector-specific applications where you'll learn how to customize and deploy these systems in real organizational contexts and specialized industries.

A concise, tool-focused reference that maps quality improvement methods to ISO and TQM frameworks, reinforcing how standards and statistical tools connect within a functioning QMS.
Lean, Six Sigma & Continuous Improvement
ExpertIntegrate Lean manufacturing principles and Six Sigma methodology into a unified continuous improvement strategy, and learn to lead improvement projects from problem definition through sustained results.
▸ Study plan for this stage
Pace: 8–10 weeks, ~40–50 pages/day. Start with the Pocket Toolbook (2–3 weeks) for methodology foundations, move to Lean Thinking (3–4 weeks) for philosophical depth, then The Improvement Guide (3–4 weeks) for practical project execution. Allow 1 week for integration and capstone work.
- Lean Six Sigma integration: combining Lean speed/waste elimination with Six Sigma statistical rigor to maximize process efficiency and quality
- DMAIC methodology (Define, Measure, Analyze, Improve, Control): the structured problem-solving framework for Six Sigma projects
- Value stream mapping and waste elimination: identifying and removing non-value-added activities (muda) to streamline operations
- Statistical tools and process capability: using data-driven metrics (Cp, Cpk, variation analysis) to quantify improvement and sustain gains
- Lean thinking principles: respect for people, continuous flow, pull systems, and eliminating overburden (muri) and unevenness (mura)
- Plan-Do-Study-Act (PDSA) cycles: the iterative improvement model for testing changes and building organizational learning
- Leading improvement projects: stakeholder engagement, change management, and sustaining results through standardization and culture
- Toolbox mastery: practical application of control charts, hypothesis testing, kaizen events, 5S, and root cause analysis in real projects
- How do Lean and Six Sigma complement each other, and when would you apply each methodology or both in a process improvement scenario?
- Walk through the DMAIC framework: what does each phase accomplish, what tools are used, and how do you know when to move to the next phase?
- What is a value stream, and how do you use value stream mapping to identify waste and design future-state processes?
- Explain the difference between muda, muri, and mura in Lean thinking, and give examples of each from a manufacturing or service context.
- How do you use the Plan-Do-Study-Act cycle to test and implement changes, and why is this better than a traditional waterfall approach?
- What statistical concepts (variation, process capability, control limits) are essential for sustaining Six Sigma improvements, and how do you communicate them to non-technical stakeholders?
- Map a real or hypothetical value stream (e.g., order-to-delivery, patient intake, software release): identify all steps, cycle times, and classify each as value-added or waste. Propose a future-state design.
- Define a process improvement project using the DMAIC framework: write a project charter (Define phase) with clear problem statement, goals, and success metrics.
- Collect process data (cycle time, defect rate, customer wait time) from a real or simulated process; calculate process capability (Cp, Cpk) and interpret the results.
- Conduct a root cause analysis using fishbone diagram or 5 Whys on a real operational problem; propose countermeasures aligned with Lean or Six Sigma principles.
- Design and run a PDSA cycle: plan a small change (e.g., 5S in a workspace, batch size reduction), implement it, measure results, and document learning.
- Lead a kaizen event simulation: facilitate a 2–3 hour workshop with peers to identify waste in a process, brainstorm improvements, and create an action plan with ownership and deadlines.
Next up: This stage equips you with the integrated Lean Six Sigma methodology and project leadership skills to drive measurable, sustained improvements; the next stage will likely deepen your capability in advanced statistical methods, organizational change management, or industry-specific applications (e.g., healthcare, supply chain, product development).
A highly practical, tool-by-tool reference that bridges Lean and Six Sigma — ideal at this stage because you now have the statistical and systems background to use every tool correctly and know when to apply each one.
The foundational text on Lean principles (value, value stream, flow, pull, perfection), grounding continuous improvement in a coherent strategic philosophy rather than a collection of isolated tools.

Presents the Model for Improvement and PDSA cycle as a universal engine for continuous improvement, synthesizing everything learned across prior stages into a repeatable, evidence-based change methodology.
Discussion
Keep reading
Paths that share books, cover the same subject, or open a related topic.