Day Trading: Best Books to Learn Strategy, Risk and Discipline
This curriculum is built for intermediate learners who already understand basic market mechanics and want to develop a complete, disciplined day trading practice. The four stages move from sharpening technical and strategic foundations, through proven setups and risk frameworks, into the mental edge that separates consistent traders from the rest — because no strategy works without the psychology to execute it.
Sharpening the Foundation
IntermediateSolidify technical analysis fluency and develop a coherent framework for reading price action and market structure before applying any specific day trading strategy.
▸ Study plan for this stage
Pace: 8–10 weeks, ~40–50 pages/day with 2–3 days per week for review and exercises
- Trend identification and classification (uptrend, downtrend, sideways) using price action and support/resistance levels
- Chart patterns (head-and-shoulders, triangles, flags, double tops/bottoms) and their reliability in predicting price movement
- Moving averages, oscillators (RSI, MACD, Stochastic), and volume analysis as confirmation tools for technical signals
- Support and resistance as dynamic price levels; how to identify, test, and trade breakouts and breakdowns
- Market structure and price action reading: understanding candlestick formations, momentum shifts, and reversal signals
- Risk management framework: position sizing, stop-loss placement, and risk-to-reward ratios specific to day trading
- Timeframe analysis and the relationship between higher timeframe trends and lower timeframe entry opportunities
- Pre-market preparation, watchlist building, and real-time trade execution discipline based on technical setups
- How do you distinguish between a genuine trend and a false breakout, and what role do support/resistance levels play in this distinction?
- Explain the difference between leading indicators (oscillators) and lagging indicators (moving averages), and why both are needed for confirmation in day trading
- What are the key characteristics of a reliable chart pattern, and why do some patterns (like head-and-shoulders) have higher success rates than others?
- How would you use volume analysis alongside price action to confirm whether a breakout is likely to sustain or fail?
- Describe your process for identifying a tradeable setup on a lower timeframe while ensuring it aligns with the higher timeframe trend direction
- What is your risk management protocol for a day trade, including position sizing, stop-loss placement, and minimum risk-to-reward ratio?
- Chart analysis drills: Analyze 10 historical daily charts and identify all support/resistance levels, trend direction, and potential chart patterns without looking at price labels first
- Indicator confirmation study: On 5 different stocks, compare moving average crossovers with RSI and MACD signals; document where they align and where they diverge
- Breakout vs. breakdown simulation: Using 15 past breakout scenarios, classify each as successful or failed, and identify the volume and price action clues that preceded the outcome
- Candlestick pattern recognition: Study 20 candlestick formations (engulfing, hammer, shooting star, doji) in real market contexts and predict the next 3–5 candles' direction
- Multi-timeframe setup building: Select 5 stocks in uptrends on the daily chart, then find 3 intraday entry opportunities on the 15-minute or 5-minute chart with proper stop-loss and target placement
- Live market observation journal: Spend 1 hour per trading day for 2 weeks observing price action in real-time without trading; document setups you see, your prediction, and the actual outcome
Next up: This stage equips you with the technical literacy and pattern recognition skills to confidently identify high-probability setups, setting the stage for the next phase where you'll integrate specific day trading strategies, refine execution discipline, and develop the psychological resilience needed for consistent profitability.
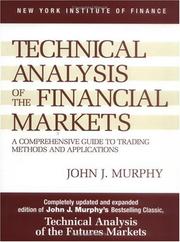
The definitive reference for technical analysis — charts, indicators, and market interrelationships. Reading this first ensures every subsequent strategy book shares a common vocabulary with you.
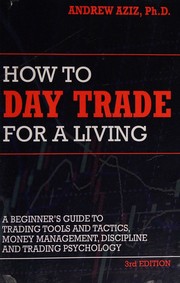
A practical, honest intermediate primer on day trading mechanics, scanners, and basic setups. It bridges general TA knowledge into the specific rhythm and routine of a day trader's session.
Strategy & Technical Setups
IntermediateLearn specific, repeatable intraday setups — price action patterns, tape reading, and momentum strategies — so you can build a defined, rules-based playbook.
▸ Study plan for this stage
Pace: 8–10 weeks, ~40–50 pages/day (3–4 hours/day including note-taking and chart review)
- Psychological discipline and emotional control as the foundation for consistent strategy execution (Douglas)
- Price action interpretation: support/resistance, trend lines, candlestick patterns, and volume analysis (Grimes)
- Technical indicator selection and proper application—moving averages, RSI, MACD, Bollinger Bands—without over-reliance (Grimes)
- Tape reading and order flow: recognizing momentum, accumulation/distribution, and institutional activity (Carter)
- Intraday setups and repeatable patterns: breakouts, reversals, pullbacks, and scalping opportunities (Carter & Grimes)
- Risk management within setups: position sizing, stop-loss placement, and profit-taking rules tied to chart structure (All three)
- Building a personal playbook: documenting setups, entry/exit rules, and performance metrics (Carter)
- The relationship between mindset, strategy, and execution—why discipline matters more than indicator perfection (Douglas & Carter)
- How does emotional discipline (as described by Douglas) directly impact your ability to follow a technical setup's rules without deviation?
- What is the difference between support/resistance levels based on price action versus arbitrary technical indicator levels, and why does Grimes emphasize this distinction?
- Describe three intraday setups from Carter's work (e.g., breakout, reversal, pullback) and the specific entry, stop-loss, and profit-target rules for each.
- How do you use tape reading and volume analysis to confirm or reject a technical setup before entering a trade?
- What are the most common mistakes traders make when applying indicators (per Grimes), and how do you avoid them in your playbook?
- How would you document and backtest one of your personal setups to measure its edge and refine it over time?
- Read Trading in the Zone (weeks 1–2): Highlight the key psychological principles Douglas outlines. Write a one-page reflection on your own emotional triggers when trading (fear, greed, overconfidence) and how you'll address them.
- Study The Art and Science of Technical Analysis (weeks 3–5): For each major pattern (support/resistance, trend lines, candlesticks, moving averages, RSI, MACD, Bollinger Bands), create a one-page reference sheet with definitions, visual examples, and when NOT to use each tool.
- Read Mastering the Trade (weeks 6–8): Document 5–7 specific intraday setups from Carter's examples. For each, write the exact entry rule, stop-loss placement, profit-target rule, and the tape-reading/volume signals that confirm it.
- Live chart review (ongoing, weeks 1–10): Spend 30 minutes daily reviewing 1–3 recent intraday charts (1-minute, 5-minute, 15-minute timeframes). Identify setups from your documented playbook; mark entries, stops, and targets. Do NOT trade yet—annotation only.
- Backtest one setup (weeks 6–10): Select one setup from Carter's work. Manually backtest it on 20–30 historical daily or intraday charts. Record win rate, average profit/loss, and risk-reward ratio. Refine the entry or exit rule based on results.
- Build your personal playbook (weeks 7–10): Create a 10–15 page document with 3–5 of your highest-conviction setups. Include entry rules, stop-loss logic, profit targets, tape-reading confirmations, and a sample annotated chart for each. This becomes your trading rulebook.
Next up: This stage equips you with a defined, rules-based playbook grounded in price action, technical analysis, and tape reading—the tactical foundation you'll now apply in live market conditions, where you'll learn position management, real-time decision-making, and the discipline to execute your setups under pressure.
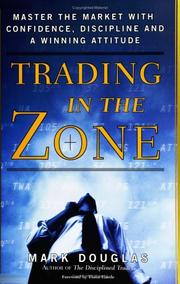
Introduced here intentionally early in the strategy stage: Douglas argues that a setup only works when you can execute it consistently, making mindset inseparable from method.

A rigorous, statistically grounded look at which chart patterns actually have edge. It teaches you to think probabilistically about setups rather than mechanically.

Covers specific intraday and swing setups, volatility triggers, and market internals used by active traders — a practical complement to Grimes's analytical framework.
Risk Management & Trade Execution
ExpertBuild a rigorous risk management system — position sizing, stop placement, reward-to-risk discipline, and portfolio-level thinking — so that no single trade or losing streak can be catastrophic.
▸ Study plan for this stage
Pace: 8–10 weeks, ~40–50 pages/day (mix of dense technical chapters and workbook-style exercises). Allocate ~5 weeks to Tharp, ~3–4 weeks to Elder, with 1 week for integration and system design.
- Position sizing as the primary lever of risk control: R-multiple, fixed fractional, and optimal f models (Tharp's core thesis)
- Stop-loss placement based on volatility, support/resistance, and technical structure—not arbitrary percentages (Elder's discipline framework)
- Reward-to-risk ratio (R:R) as a non-negotiable filter: why 1:2 or better is essential for long-term profitability
- The psychology of accepting losses and the emotional discipline required to execute stops without hesitation
- Portfolio-level risk: correlation, diversification, and aggregate exposure across multiple positions
- Trade expectancy and the math of edge: how position size, win rate, and R:R combine to determine long-term returns
- System design and backtesting: validating your rules before risking real capital
- The difference between risk of ruin and risk of loss: why 2% per trade is a practical floor, not a ceiling
- Explain Tharp's concept of R-multiples and optimal f. How does position sizing based on R differ from fixed-dollar or fixed-percentage approaches?
- What is the relationship between reward-to-risk ratio, win rate, and expectancy? Show the math with a concrete example.
- Describe Elder's three-screen trading system and how it informs stop placement. Why does volatility matter more than a fixed percentage?
- How do you calculate the risk of ruin for your trading system, and what position size would you choose to keep it below 5%?
- What is the difference between a trade-level risk rule (e.g., 2% per trade) and portfolio-level risk management? Give an example of when they conflict.
- Design a position-sizing rule for a hypothetical trading system with a 55% win rate, 1.5:1 R:R, and a $50,000 account. Justify your choice.
- Work through Tharp's position-sizing worksheets (Chapter 7–8 of Trade Your Way): calculate optimal f and fixed fractional sizing for a sample trading system with real historical data.
- Backtest a simple trading strategy (e.g., 20-day breakout) and extract the win rate, average win, and average loss. Then calculate expectancy and determine the maximum position size that keeps risk of ruin below 5%.
- Analyze 10 of your own past trades (real or paper). For each, identify where you placed your stop and why. Then re-evaluate: was it based on volatility, structure, or emotion? Reposition using Elder's volatility-based method.
- Create a personal risk policy document: specify your maximum risk per trade, portfolio heat (total exposure), maximum consecutive losses before stepping back, and correlation limits for multi-position portfolios.
- Paper-trade a 2-week period using strict 2% risk-per-trade sizing and Elder's three-screen entry filters. Track every trade, stop placement, and the emotional difficulty of executing stops.
- Build a simple spreadsheet model: input your account size, win rate, R:R, and position size. Calculate expected monthly return, drawdown, and risk of ruin. Experiment with different position sizes to see the trade-off between growth and safety.
Next up: This stage establishes the non-negotiable guardrails—position sizing, stops, and portfolio limits—that allow you to survive long enough to profit from your edge; the next stage will focus on identifying and validating that edge through systematic strategy development and backtesting.
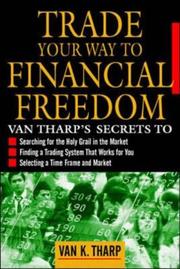
The canonical book on position sizing and expectancy. Tharp reframes trading success as a function of risk management first, strategy second — a perspective shift every trader needs.

Elder's Triple Screen system and his '2% Rule' for risk per trade are industry standards. This book ties strategy, indicators, and money management into one coherent operating system.
Trading Psychology & Peak Performance
ExpertInternalize the mental disciplines — emotional regulation, consistency under pressure, handling drawdowns — that determine whether a technically sound trader actually profits over time.
▸ Study plan for this stage
Pace: 8–10 weeks, ~25–30 pages/day. Start with "The Disciplined Trader" (4–5 weeks, ~20 pages/day for depth and reflection), then "Reminiscences of a Stock Operator" (3–4 weeks, ~30 pages/day for narrative momentum). Build in weekly review and journaling time.
- The belief system: how your internal rules and assumptions about markets directly shape trading decisions and outcomes, even when they contradict technical analysis
- Emotional discipline and the pain of loss: recognizing that fear and greed are neurological responses, not character flaws, and learning to trade *despite* them rather than waiting to feel confident
- Consistency and process over outcomes: accepting that you cannot control individual trade results, only your adherence to a pre-defined trading plan and risk rules
- Drawdowns as inevitable: understanding that losing streaks and equity curves are part of the game, and that psychological resilience during drawdowns separates profitable traders from those who blow up accounts
- The trader's edge and probability: grasping that an edge is a probabilistic advantage (not a guarantee), and that compounding small, consistent wins requires patience and trust in the process
- Tape reading and market intuition: learning to observe price action and volume patterns with detachment, and recognizing when emotion is masking or distorting what the market is actually telling you
- Accountability and record-keeping: maintaining detailed trade journals to separate ego-driven narratives from objective performance data, enabling honest self-assessment
- According to Mark Douglas, what is a 'belief' in trading, and how does a limiting belief (e.g., 'I must win every trade') sabotage technical execution?
- What does Douglas mean by 'trading in the zone,' and what mental conditions must be present for a trader to operate there consistently?
- In 'Reminiscences,' how did Jesse Livermore's emotional reactions to losses—particularly his fear and overconfidence—lead him to deviate from his own rules, and what were the consequences?
- Explain the concept of 'risk of ruin' and how it relates to position sizing and psychological resilience. How does Livermore's experience illustrate this?
- What is the relationship between a trader's internal dialogue (self-talk) and their ability to execute a trading plan under pressure? Provide examples from Douglas.
- How does keeping a detailed trading journal help separate emotional narratives from objective performance data? What specific insights should a journal reveal?
- Trading Journal Deep Dive: For every trade (real or simulated), record not just entry/exit and P&L, but also your emotional state before entry, any self-doubt or overconfidence during the trade, and how you felt at exit. Review weekly to identify emotional patterns and limiting beliefs.
- Belief Audit: List 5–10 beliefs you hold about trading (e.g., 'I must be right 70% of the time to be profitable,' 'Losses mean I'm a bad trader'). For each, identify how it influences your decision-making. Reframe each as a probability-based, process-focused belief.
- Drawdown Simulation: Backtest your trading strategy and identify the largest historical drawdown. Write a detailed plan for how you would mentally and operationally respond if that drawdown occurred in real-time. Practice this response in a paper-trading environment.
- Tape Reading Practice: Spend 30 minutes daily observing live price action (1–5 minute charts) without trading. Focus on volume patterns, support/resistance, and momentum shifts. Write down what you observe without judgment. Compare your observations to actual price moves over the next hour.
- Livermore Case Study: Select 3–4 key moments from 'Reminiscences' where Livermore's psychology either enhanced or destroyed his performance. For each, write a 1-page analysis of what belief or emotional state drove his decision, and what the 'disciplined' alternative would have been.
- Pre-Trade Ritual: Develop a 5–10 minute mental routine (breathing, visualization, affirmation) to execute before each trade. Practice it daily for 2 weeks, then use it in live or paper trading. Track whether it improves your adherence to your trading plan.
Next up: This stage establishes the psychological and emotional foundation required for sustainable profitability; the next stage will build on this discipline by teaching you how to identify, test, and refine specific trading systems and edge-based strategies that actually work in live markets.
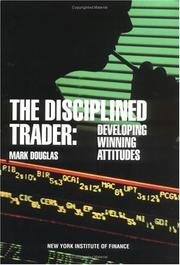
Douglas's first book goes deeper into the psychological roots of self-sabotage in trading. Read after his second book to understand the 'why' behind the mental framework he prescribes.
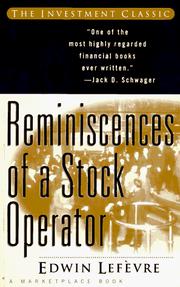
A fictionalized biography of Jesse Livermore that remains the most enduring account of how speculation, discipline, and ego interact over a trading career — timeless lessons in narrative form.
Discussion
Keep reading
Paths that share books, cover the same subject, or open a related topic.