Reading Financial Statements: Best Books on Financial Statement Analysis
This curriculum is built for an intermediate learner who already understands basic accounting concepts and wants to move from reading financial statements to truly analyzing a company's health. The path moves from mastering the three core statements in isolation, to integrating them for deep analysis, and finally to applying forensic and valuation-level thinking used by professional investors and analysts.
Mastering the Three Statements
IntermediateDevelop fluency in reading and interpreting the balance sheet, income statement, and cash flow statement individually, and understand how they connect to each other.
▸ Study plan for this stage
Pace: 4–5 weeks, ~40–50 pages/day (mix of reading and active note-taking)
- The balance sheet as a snapshot of assets, liabilities, and equity at a specific point in time, and how the accounting equation (Assets = Liabilities + Equity) governs its structure
- The income statement as a flow statement showing revenues, expenses, and profitability over a period, and how net income connects to retained earnings on the balance sheet
- The cash flow statement broken into three sections (operating, investing, financing) and why net income differs from actual cash generated
- How the three statements articulate: net income flows to the balance sheet, cash flow reconciles net income to actual cash movement, and changes in balance sheet accounts drive cash flow categories
- Common-size analysis and ratio interpretation (gross margin, operating margin, return on assets, return on equity) to assess financial health and performance trends
- The role of working capital, depreciation, and accruals in understanding the gap between accounting profits and economic cash reality
- How to read and critique financial statement footnotes and accounting policy choices that affect reported numbers
- Explain the accounting equation and how a transaction (e.g., borrowing $100,000) affects all three financial statements
- Why can a company report high net income on the income statement but have negative cash flow from operations? Walk through a specific example
- What is the difference between the balance sheet and the cash flow statement, and why do you need both to understand a company's financial position?
- How do depreciation and amortization affect the income statement, balance sheet, and cash flow statement differently?
- Calculate and interpret key ratios (gross margin, operating margin, ROA, ROE) for a real company and explain what they reveal about performance
- Trace a change in accounts receivable from the balance sheet through the cash flow statement and explain its impact on operating cash flow
- Work through Ittelson's step-by-step examples of how transactions flow through all three statements; recreate one example from scratch without reference
- Obtain 2–3 years of financial statements for a company you know (Apple, Amazon, or a smaller public company); manually calculate common-size percentages and key ratios
- Create a simple balance sheet, income statement, and cash flow statement for a fictional small business over two years; ensure all three articulate correctly
- Read the MD&A (Management Discussion & Analysis) and footnotes for a real company; identify 2–3 accounting policy choices and estimate their impact on reported earnings
- Compare the income statement and cash flow statement for the same company; identify the largest reconciling items (e.g., depreciation, changes in working capital) and explain why they exist
- Use Graham's interpretive framework to assess whether a company's financial statements suggest it is a 'defensive' or 'enterprising' investment based on margin trends, asset quality, and cash generation
Next up: Mastery of the three statements individually and their interconnections establishes the foundation for the next stage, which will deepen analysis through multi-year trend analysis, financial modeling, and valuation techniques that depend on fluent statement interpretation.
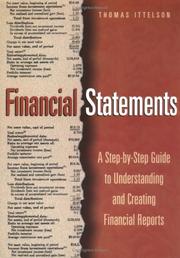
A highly visual, plain-English walkthrough of all three core statements and how they interlock — the perfect starting point to build precise vocabulary and intuition before tackling denser texts.

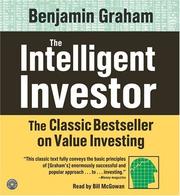
Graham's concise classic sharpens your eye for what the numbers actually mean versus what management wants you to see — essential discipline to install early in the learning path.
The Cash Flow Advantage
IntermediateUnderstand why cash flow is the most reliable signal of a company's true health, and learn to spot the gap between reported earnings and real cash generation.
▸ Study plan for this stage
Pace: 4–5 weeks, ~40–50 pages/day. Start with "The Financial Numbers Game" (2–3 weeks), then move to "Cash Flow and Security Analysis" (2–3 weeks). Allocate 2–3 days for review and integration exercises at the end.
- Earnings manipulation techniques: how companies use accounting discretion to inflate reported profits while cash flow remains stagnant or declining
- The cash conversion cycle: understanding the timing gap between when expenses are paid, revenue is recognized, and cash is actually collected
- Quality of earnings assessment: learning to distinguish between sustainable cash-backed earnings and one-time gains or accounting adjustments
- Red flags in financial statements: identifying warning signs such as growing receivables without revenue growth, inventory buildup, and deferred revenue patterns
- Operating cash flow as the true measure of profitability: why OCF is more reliable than net income for assessing business health
- The relationship between accruals and cash flow: recognizing that high accruals relative to earnings signal lower earnings quality
- Cash flow statement analysis: mastering the three sections (operating, investing, financing) and what each reveals about management's priorities and company sustainability
- Security analysis using cash flow metrics: applying cash flow analysis to make informed investment decisions and identify overvalued or undervalued companies
- What are the primary techniques companies use to manipulate reported earnings, and how can you detect these manipulations by examining the cash flow statement?
- Why is operating cash flow a more reliable indicator of a company's financial health than net income, and what circumstances might cause them to diverge significantly?
- How do you calculate and interpret the cash conversion cycle, and what does a lengthening cycle tell you about a company's operational efficiency?
- What are the key red flags in financial statements that suggest earnings quality is poor, and how do you verify these concerns using cash flow analysis?
- How do you use the three sections of the cash flow statement (operating, investing, financing) to build a complete picture of a company's financial strategy and sustainability?
- Given a set of financial statements, how would you identify whether reported earnings are backed by actual cash generation, and what would you do if they diverge?
- Analyze 3–5 real companies' financial statements side-by-side: compare their reported net income to operating cash flow over 3–5 years. Document where they diverge and hypothesize why using the earnings manipulation techniques from Mulford.
- Create a cash conversion cycle calculation for 2–3 companies in the same industry. Track how the cycle changes over time and assess what this reveals about competitive positioning and operational efficiency.
- Identify and document 5–10 specific red flags from actual 10-K filings (e.g., growing accounts receivable without revenue growth, unusual accruals). Cross-reference these with cash flow statement findings to confirm your suspicions.
- Perform a quality-of-earnings assessment on one company: calculate the ratio of operating cash flow to net income for the past 3–5 years, identify accrual patterns, and write a one-page summary of earnings quality.
- Reconstruct the three sections of a cash flow statement from a company's balance sheet and income statement changes, then compare your reconstruction to the actual statement to verify your understanding.
- Conduct a mini security analysis on two companies in the same sector: use cash flow metrics (OCF, free cash flow, cash conversion cycle) to determine which is the better investment and justify your conclusion in writing.
Next up: This stage equips you with the analytical tools to see through accounting illusions and identify true financial health; the next stage will build on this foundation by teaching you how to value companies based on their real cash-generating ability and construct a defensible investment thesis.
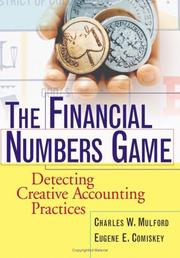
Exposes how companies legally manipulate accrual earnings while cash flow tells the real story — reading this right after Graham cements why cash flow deserves its own deep focus.

The most rigorous dedicated treatment of free cash flow analysis available; builds a systematic framework for using cash flow statements to assess financial strength and intrinsic value.
Integrated Company Analysis
IntermediateLearn to read all three statements together as a unified story, assess competitive position, and identify red flags or quality signals across the full financial picture.
▸ Study plan for this stage
Pace: 8–10 weeks, ~40–50 pages/day. Start with Fridson's "Financial Statement Analysis" (weeks 1–5, ~250 pages), then transition to O'glove's "Quality of Earnings" (weeks 6–10, ~200 pages). Allocate 1–2 days per week for case studies and integration exercises.
- The three-statement model as an integrated narrative: how the income statement, balance sheet, and cash flow statement connect and reveal the true economic story of a company
- Common-size and trend analysis across all three statements to spot operational changes, margin compression, and cash generation patterns
- Working capital dynamics and their impact on cash flow: how changes in receivables, inventory, and payables signal operational health or distress
- Quality of earnings: distinguishing sustainable, cash-backed profits from accounting manipulations, one-time gains, and aggressive revenue recognition
- Red flags and forensic signals: identifying unsustainable growth, deteriorating asset quality, related-party transactions, and earnings management tactics
- Competitive positioning through financial metrics: using profitability ratios, return on invested capital (ROIC), and asset turnover to assess competitive advantage
- Cash flow quality assessment: evaluating whether reported earnings translate into actual cash and identifying warning signs like growing receivables relative to revenue growth
- How do changes in the balance sheet (receivables, inventory, payables) explain movements in cash flow that the income statement alone would not reveal?
- What are the primary red flags in financial statements that suggest earnings manipulation or unsustainable accounting practices, and how would you detect them using Fridson's and O'glove's frameworks?
- How would you use common-size and trend analysis across all three statements to assess whether a company's competitive position is strengthening or weakening?
- What is the difference between reported earnings and quality earnings, and what specific line items or accounting choices should you scrutinize to determine earnings quality?
- How would you evaluate whether a company's growth is being driven by operational improvements or by working capital management, accounting changes, or one-time items?
- What patterns in the relationship between revenue growth, receivables growth, and cash flow from operations would signal potential revenue quality issues?
- Analyze a complete set of three financial statements (10-K) for a real company: prepare common-size versions of the income statement and balance sheet, calculate year-over-year trends, and write a one-page narrative explaining how the three statements tell a unified story about the company's performance and financial health.
- Perform a quality-of-earnings assessment on a company with reported earnings growth: identify specific accounting policies, accruals, and one-time items that affect reported earnings; calculate adjusted earnings and compare to reported earnings; assess the sustainability of the reported growth rate.
- Conduct a working capital analysis for two competitors in the same industry: calculate days sales outstanding (DSO), days inventory outstanding (DIO), and days payable outstanding (DPO) for both companies over 3–5 years; explain how differences in working capital management affect their cash flow profiles and competitive positioning.
- Red flag hunt: review the MD&A and footnotes of a company's 10-K and identify 5–8 potential warning signs using Fridson's and O'glove's frameworks; for each flag, explain what it suggests and what additional analysis you would perform.
- Comparative competitive analysis: select three companies in the same industry and create a summary table of key profitability ratios (gross margin, operating margin, net margin), ROIC, and cash conversion metrics over 3 years; write an analysis of which company has the strongest competitive position and why.
- Cash flow quality deep dive: for a company with strong reported earnings, trace the earnings through the cash flow statement; identify the largest accruals and working capital changes; assess whether the company is converting earnings into cash and identify any concerning trends.
Next up: This stage equips you with the integrated analytical framework and red-flag detection skills needed to move into advanced topics like valuation, capital allocation decisions, and sector-specific financial analysis, where you'll apply these three-statement insights to make investment or lending decisions.
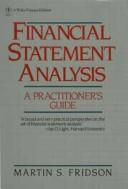
A practitioner-level guide that teaches ratio analysis, trend analysis, and cross-statement synthesis — the bridge from reading individual statements to analyzing a whole company.
A Wall Street classic that teaches you to assess whether reported earnings are high or low quality by cross-referencing footnotes, cash flows, and accounting choices — critical for real-world analysis.
Forensic & Forensic-Level Thinking
ExpertDetect accounting manipulation, earnings management, and fraud signals hidden inside financial statements, using the techniques of forensic accountants and short-sellers.
The definitive guide to detecting earnings manipulation and cash flow shenanigans; packed with real case studies that train your eye to spot what companies hide in plain sight.

Teaches you to read financial statements from the adversarial perspective of a short-seller — the ultimate stress test of your analytical skills and a masterclass in finding overvalued or fraudulent companies.
Valuation & the Full Picture
ExpertTranslate deep financial statement analysis into a rigorous estimate of a company's intrinsic value, connecting accounting reality to investment decision-making.
▸ Study plan for this stage
Pace: 8–10 weeks, ~40–50 pages/day (with modeling work interspersed)
- Discounted Cash Flow (DCF) valuation: building explicit forecast periods, terminal value calculation, and discount rate determination
- Cost of equity and WACC: estimating required returns using CAPM, adjusting for risk, and applying to different geographies and company types
- Terminal value methods: perpetuity growth, exit multiples, and sensitivity to long-term assumptions
- Relative valuation: understanding when and how to use multiples (P/E, EV/EBITDA, Price-to-Book) as cross-checks to DCF
- Adjusting financial statements for valuation: normalizing earnings, treating one-time items, and converting accrual accounting to cash flow
- Valuation of different company types: mature firms, high-growth companies, cyclical businesses, and distressed situations
- Connecting valuation to investment decisions: margin of safety, sensitivity analysis, and scenario testing
- Real-world complications: currency effects, taxes, leverage, and how accounting choices distort intrinsic value estimates
- How do you build a DCF model from financial statements, and what are the critical assumptions that drive valuation output?
- What is the difference between cost of equity and WACC, and how do you estimate each using real company data?
- How do you calculate and justify a terminal value, and why is it often the largest component of enterprise value?
- When should you use relative valuation multiples instead of DCF, and how do you reconcile differences between the two approaches?
- What adjustments must you make to reported earnings and cash flows before using them in a valuation model?
- How does valuation change for high-growth, mature, and cyclical companies, and what assumptions differ across these types?
- What is margin of safety, and how do you use sensitivity analysis to stress-test your valuation estimate?
- Build a 5-year explicit forecast DCF model for a mature company (e.g., a large-cap industrial or consumer firm) using 3 years of historical financials; calculate WACC and terminal value using perpetuity growth, then derive enterprise and equity value
- Estimate cost of equity for a company using CAPM: gather beta from market data, set risk-free rate and market risk premium, and explain your choices; compare to WACC-implied cost of equity
- Perform a terminal value sensitivity analysis: create a table showing how enterprise value changes with different perpetuity growth rates (±1–2%) and WACC assumptions (±0.5–1%), and identify which assumptions matter most
- Value the same company using 3 relative valuation methods (P/E, EV/EBITDA, Price-to-Book), compare to your DCF value, and write a brief memo explaining any gaps
- Adjust a company's reported earnings for 2–3 significant one-time items or accounting choices (e.g., stock-based compensation, acquisition-related charges, pension assumptions); recalculate normalized EBITDA and free cash flow
- Build a DCF model for a high-growth company (e.g., a SaaS or biotech firm) with explicit forecasts only through inflection point, then model transition to mature growth; compare to a mature-company model to see how growth assumptions change valuation
- Conduct a 3-scenario valuation (base, bull, bear) for a company, assign probabilities to each, and calculate probability-weighted intrinsic value; document key assumption differences between scenarios
Next up: This stage equips you with the quantitative framework and judgment to translate financial statement analysis into a defensible intrinsic value estimate; the next stage will likely focus on applying this valuation discipline to real portfolio decisions, sector-specific valuation challenges, or advanced topics like M&A pricing and private company valuation.

The most comprehensive and rigorous valuation text available; shows exactly how every line of the financial statements feeds into DCF models, multiples, and intrinsic value — the capstone of the entire curriculum.
Discussion
Keep reading
Paths that share books, cover the same subject, or open a related topic.