Technical analysis: an ordered reading path for chart traders
This curriculum builds from a solid intermediate foundation in technical analysis through to advanced trading strategy and risk management. Each stage sharpens a specific layer of skill — chart reading, indicator mastery, price action, and professional-grade execution — so that every book prepares the reader for the next, culminating in a complete, battle-tested trading framework.
Charting Foundations & Market Structure
IntermediateMaster the core language of technical analysis: chart types, classic patterns, trend theory, volume, and support/resistance — the vocabulary every later book assumes you already know.
▸ Study plan for this stage
Pace: 8–10 weeks, ~40–50 pages/day (Murphy first 4–5 weeks, then Schwager 3–4 weeks, with 1 week for integration and review)
- Chart types (bar, candlestick, point-and-figure) and how to read price action from each
- Classic chart patterns (head-and-shoulders, triangles, flags, double tops/bottoms) and their predictive implications
- Trend theory: defining uptrends, downtrends, and sideways markets using higher highs/lows and support/resistance
- Support and resistance levels: how to identify them, why they matter, and how price reacts at these zones
- Volume analysis: how volume confirms or contradicts price moves and signals trend strength
- Moving averages and trend-following tools as foundational technical indicators
- The Dow Theory principles underlying modern technical analysis
- Real-world trader psychology and decision-making from Schwager's interviews (how pros apply these concepts in practice)
- What are the three main chart types and what unique information does each one reveal about price action?
- Describe a head-and-shoulders pattern and explain why it is considered a reversal signal.
- How do you distinguish between an uptrend, downtrend, and sideways market using the concept of higher highs and lows?
- What is the relationship between volume and price movement, and what does declining volume on a rally typically signal?
- How would you identify and draw support and resistance levels on a real chart, and what happens when price breaks through them?
- According to the traders interviewed in Stock Market Wizards, how do they use chart patterns and support/resistance in their actual trading decisions?
- Chart annotation exercise: Print or screenshot 5 real price charts (different timeframes and assets) and manually identify and label support, resistance, trend lines, and classic patterns (at least 2 patterns per chart).
- Pattern recognition drill: Use a charting platform (TradingView, TC2000, or similar) and spend 30 minutes daily for 2 weeks identifying live chart patterns in real time; keep a log of patterns spotted and their outcomes over the following 1–2 weeks.
- Volume confirmation practice: On 10 different charts, mark price moves and assess whether volume increased or decreased; write one sentence explaining what the volume action suggests about trend strength.
- Trend definition exercise: Take 3 charts in different trend states (clear uptrend, clear downtrend, sideways) and draw trend lines, mark higher highs/lows, and identify the next likely support or resistance level.
- Schwager interview application: Read 2–3 interviews from Stock Market Wizards and write a 1-page summary of how that trader uses support/resistance, patterns, or volume in their approach; compare it to Murphy's framework.
- Live chart journal: For 2 weeks, maintain a daily chart journal where you sketch or describe one price pattern you observe, note the volume action, identify support/resistance, and predict the next move—review your predictions weekly to calibrate your pattern recognition.
Next up: This stage equips you with the visual and structural vocabulary of markets—the patterns, levels, and volume signals that all subsequent technical analysis builds upon—so you can move forward to indicator-based analysis, trading psychology, and risk management with a solid foundation in how to read what the market is actually doing.
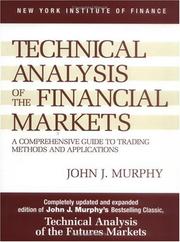
The definitive reference text for technical analysis — covers every foundational concept (trends, patterns, indicators, intermarket relationships) in a logical, encyclopedic order. Starting here ensures no gaps in vocabulary.

Reading top traders' real-world perspectives immediately after Murphy grounds abstract theory in live market context, revealing how professionals actually apply technical tools.
Chart Patterns & Price Action Mastery
IntermediateDevelop a deep, pattern-recognition eye for price action — reading candlesticks, classical chart formations, and supply/demand dynamics with precision and context.
▸ Study plan for this stage
Pace: 8–10 weeks, ~40–50 pages/day. Start with Bulkowski (3–4 weeks, ~50 pages/day for dense pattern reference), then Nison (2–3 weeks, ~40 pages/day for candlestick technique), then Douglas (2–3 weeks, ~30 pages/day for psychological integration).
- Classical chart patterns (head-and-shoulders, triangles, flags, wedges, rectangles) and their statistical reliability, breakout rules, and failure modes per Bulkowski's research
- Candlestick formation anatomy: real bodies, wicks, open-close relationships, and how individual candles signal reversal or continuation intent
- Candlestick pattern sequences (engulfing, harami, morning/evening stars, doji, hammer, shooting star) and their contextual strength in trends vs. consolidations
- Supply and demand zones: how price respects prior resistance/support, how patterns form at these levels, and why price returns to them
- Price action reading: distinguishing genuine breakouts from false ones, recognizing rejection wicks, and interpreting volume-price relationships within patterns
- Psychological drivers of price movement: fear, greed, and indecision as reflected in candlestick shapes and pattern formation
- Trading psychology and emotional discipline: managing expectation, handling losses, and maintaining objectivity when reading patterns in real time
- What are the key statistical characteristics of a head-and-shoulders pattern per Bulkowski, and what percentage of them result in successful breakouts? When does this pattern fail?
- Explain the anatomy of a bullish engulfing candlestick and why it signals potential reversal. How does context (trend, support level, volume) change its reliability?
- How do morning star and evening star patterns differ in formation and what psychological shift do they represent in the market?
- What is the relationship between supply/demand zones and classical chart patterns? Why do patterns repeatedly form at the same price levels?
- Describe the difference between a genuine breakout and a false breakout using candlestick and price action signals. What role does volume play?
- How does Mark Douglas define the trader's edge, and why is psychological discipline as important as pattern recognition when executing trades based on chart patterns?
- Chart annotation drill: Print or screenshot 20 historical daily charts (various assets, timeframes). Identify and label all classical patterns (Bulkowski) with entry/exit levels, then compare your predictions to actual price movement. Track accuracy by pattern type.
- Candlestick pattern journal: For 2 weeks, daily scan 5–10 charts and document every candlestick reversal/continuation pattern you spot (Nison). Record the pattern name, context (trend, support/resistance), and predicted direction. Review weekly to identify which patterns you recognized correctly.
- Supply/demand zone mapping: Select 3 stocks or forex pairs. Mark all major support and resistance zones over the past 6 months. Then overlay classical patterns and candlestick formations on those zones. Note how often patterns form exactly at supply/demand boundaries.
- Live chart reading (paper trading): Spend 30 minutes daily for 2 weeks watching intraday charts in real time. Identify patterns and candlestick signals as they form. Document your read (bullish/bearish signal, confidence level, reasoning). Do NOT trade real money; focus on pattern recognition accuracy.
- Breakout vs. false breakout analysis: Find 15 examples of breakouts from classical patterns in historical data. For each, identify the candlestick signals and price action that preceded the breakout. Classify as genuine or false and explain why using Nison's candlestick logic.
- Psychology-pattern integration exercise: After reading Douglas, revisit 5 of your annotated charts. For each pattern, write a brief narrative: what fear/greed/indecision does this pattern reveal? How would Douglas say a trader should mentally approach this setup to avoid emotional error?
Next up: This stage equips you with the visual and psychological foundation to read price action with precision; the next stage will layer in entry/exit mechanics, risk management rules, and systematic trade execution to convert pattern recognition into profitable, repeatable trading systems.
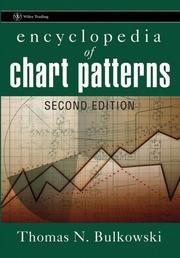
The most statistically rigorous catalog of chart patterns ever written; after Murphy's theory, Bulkowski provides hard performance data so you learn which patterns actually work.

The authoritative Western introduction to candlestick analysis — read after classical patterns to add a second, complementary visual language for reading price action bar by bar.
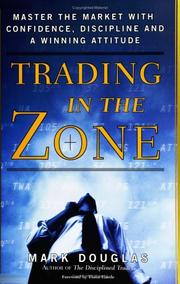
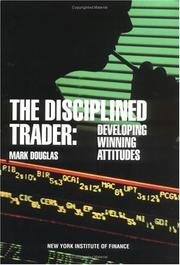
Pattern recognition is useless without the right mindset; Douglas addresses the psychological discipline needed to execute on what you see, bridging pattern study and live trading.
Indicators, Systems & Market Dynamics
IntermediateUnderstand how to build, combine, and critically evaluate technical indicators and trading systems — moving beyond pattern spotting to systematic, rules-based decision making.
▸ Study plan for this stage
Pace: 8–10 weeks, ~25–35 pages/day. Week 1–3: Shannon's "Technical Analysis Using Multiple Timeframes" (~250 pages); Week 4–5: Elder's "Come Into My Trading Room" (~300 pages); Week 6–8: Review, integration exercises, and system building; Week 9–10: Live paper trading and refinement.
- Multiple timeframe analysis: using daily, weekly, and intraday charts to confirm trend direction and entry/exit signals
- Indicator combination and confluence: layering momentum, trend-following, and volatility indicators to reduce false signals
- The Elder Triple Screen system: a rules-based framework integrating trend, momentum, and entry timing across timeframes
- Risk management and position sizing: how to define stop losses, calculate risk-to-reward ratios, and size positions systematically
- System rules and mechanical trading: converting subjective observations into explicit, testable entry and exit rules
- Market regime recognition: identifying trending vs. ranging markets and adapting indicator interpretation accordingly
- Psychological discipline and trading psychology: managing emotions, avoiding overtrading, and sticking to system rules
- How do you use multiple timeframes (e.g., weekly trend + daily entry) to filter out false signals and improve trade quality?
- What is the Elder Triple Screen system, and how do its three components (trend, momentum, entry) work together to generate trades?
- How do you combine two or more indicators (e.g., moving average + RSI + MACD) to create confluence and reduce whipsaws?
- What are the key differences in how you interpret indicators in a trending market versus a ranging/choppy market?
- How do you convert a subjective trading idea into a mechanical system with explicit entry, exit, and stop-loss rules?
- What role does position sizing and risk management play in a rules-based trading system, and how do you calculate it?
- Build a multi-timeframe analysis template: for 5 stocks or currency pairs, analyze the weekly trend, daily momentum, and intraday entry setup. Document your observations and note which trades meet your confluence criteria.
- Implement the Elder Triple Screen on a live or historical chart: identify the primary trend (weekly), confirm momentum (daily), and time entries (intraday). Backtest 20 trades and record win rate and risk-to-reward.
- Create a personal trading system document: write out 10–15 explicit rules covering entry conditions, exit conditions, stop-loss placement, and position sizing. Test it on 30 historical trades.
- Indicator combination experiment: choose 3 indicators (e.g., moving average, RSI, MACD) and test different combinations on 10 charts. Document which combinations reduce false signals most effectively.
- Paper trade for 2–3 weeks using your system rules: execute 15–20 trades on a paper trading platform, tracking entry reason, exit reason, P&L, and adherence to rules. Identify where emotions caused rule violations.
- Market regime identification drill: label 50 daily charts as 'trending' or 'ranging' using Shannon's and Elder's criteria. Compare your labels with a peer or mentor; refine your regime recognition.
Next up: This stage equips you with a systematic, rules-based framework and the discipline to execute it consistently; the next stage will deepen your ability to optimize systems through backtesting, walk-forward analysis, and position management across multiple timeframes and market conditions.
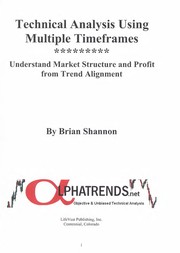
Teaches how to align indicators and price action across timeframes for high-probability setups — a crucial bridge between knowing indicators and knowing when to trust them.

Elder's Triple Screen system integrates multiple indicators and timeframes into a coherent trading methodology, building directly on Shannon's multi-timeframe thinking with explicit entry/exit rules.
Advanced Strategy, Risk & Professional Execution
ExpertSynthesize everything into a professional-grade trading plan — mastering position sizing, risk management, trade management, and the mindset of consistently profitable traders.
▸ Study plan for this stage
Pace: 8–10 weeks, ~40–50 pages/day. "Trade Your Way to Financial Freedom" (weeks 1–5, ~350 pages); "The New Market Wizards" (weeks 6–10, ~400 pages). Allocate 1–2 days per week for review, reflection, and exercise completion.
- Position sizing and the Kelly Criterion: how to calculate optimal trade size based on your win rate and risk/reward ratio to maximize long-term wealth growth
- The System Quality Number (SQN) and expectancy: quantifying edge and using statistical measures to validate trading systems before risking capital
- Trade management and exit discipline: the difference between mechanical exits, profit-taking strategies, and psychological triggers that derail execution
- Risk management as the foundation of profitability: how to define risk per trade, portfolio heat, and drawdown limits to survive losing streaks
- The psychology of consistent trading: beliefs, emotional control, and the mindset shifts required to follow your plan when real money is on the line
- Market wizard interviews and real-world trading stories: learning from successful traders' approaches to strategy, risk, and adaptation across different market conditions
- System development and validation: building a repeatable trading plan with clear entry, exit, and position-sizing rules backed by historical testing
- The trader's edge and expectancy calculation: understanding how small edges compound over hundreds of trades into significant wealth
- How do you calculate the Kelly Criterion for your trading system, and why is it dangerous to use the full Kelly percentage in practice?
- What is the System Quality Number (SQN), and how does it help you evaluate whether a trading system is worth trading with real money?
- Explain the relationship between win rate, average win size, average loss size, and expectancy. How do you use this to compare two different trading systems?
- What are the key components of a professional trading plan, and how do position sizing, risk limits, and trade management rules work together to ensure consistency?
- Describe the psychological challenges that prevent traders from following their systems, and what mindset shifts are necessary to overcome them (based on the market wizard interviews)?
- How should you define and manage portfolio heat (total risk across all open positions), and what drawdown limits should trigger a pause in trading?
- Calculate the Kelly Criterion for your own trading system (or a hypothetical system): determine your win rate, average win, average loss, and compute the optimal position size. Then compare it to a fractional Kelly approach (e.g., 25% Kelly) and explain why professionals use fractional Kelly.
- Backtest a simple trading system (using historical data or a simulator) and calculate its SQN, expectancy, and Profit Factor. Document whether these metrics suggest the system is tradeable, and identify which metric is most important for your decision.
- Build a written trading plan for a specific market or timeframe: include entry rules, exit rules (both profit-taking and stop-loss), position-sizing formula, maximum risk per trade, portfolio heat limit, and rules for when to stop trading (e.g., after 2 consecutive losses or 5% monthly drawdown).
- Conduct a personal psychology audit: identify 3–5 of your biggest emotional triggers when trading (e.g., fear of missing out, revenge trading after a loss, overconfidence after wins). For each, write a specific rule or pre-planned response that you will follow to stay disciplined.
- Read and analyze 3 market wizard interviews from 'The New Market Wizards': for each wizard, extract their core trading philosophy, risk management approach, and the one biggest mindset principle they emphasize. Compare and contrast their approaches.
- Simulate a 10-trade sequence with your trading plan: use paper trading or a simulator to execute 10 trades following your exact rules. After each trade, journal your emotional state and whether you followed your plan. Identify any deviations and why they occurred.
Next up: This stage equips you with the professional frameworks, quantitative tools, and psychological insights needed to execute a disciplined, edge-based trading plan—preparing you to either specialize in a specific market/strategy or advance to portfolio-level thinking and institutional trading concepts.

Tharp's expectancy framework and position-sizing models transform a collection of setups into a statistically sound trading system — essential reading before managing real risk at scale.

Closing with elite traders' advanced insights on risk, discipline, and edge consolidates every technical and psychological lesson from the curriculum into a unified professional philosophy.
Discussion
Keep reading
Paths that share books, cover the same subject, or open a related topic.