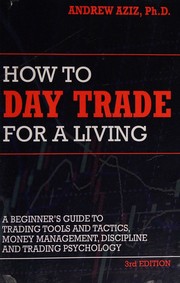
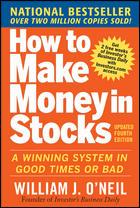
Forex trading books to read in order, beginner to pro
This curriculum is built for an intermediate learner who already understands basic market concepts and wants to trade the FX market with real discipline. The four stages move from forex-specific mechanics and mindset, through technical and fundamental analysis, into professional-grade strategy and risk management — each stage building the vocabulary and frameworks needed for the next.
Forex Mechanics & Market Structure
IntermediateUnderstand how the forex market is structured, how currency pairs and leverage work, and how professional participants think — establishing the mental model everything else builds on.
▸ Study plan for this stage
Pace: 4–5 weeks, ~40–50 pages/day (approximately 280–350 pages total across both books)
- Currency pair notation, bid-ask spreads, and pip values: the language and mechanics of forex pricing
- How leverage and margin work: amplifying returns and understanding drawdown risk in real terms
- Market structure: spot market, forwards, and futures; the role of central banks, commercial banks, and retail traders
- The forex market's 24-hour global nature: how time zones, liquidity sessions, and volatility patterns affect trading opportunities
- Major, minor, and exotic currency pairs: characteristics, volatility profiles, and why professionals focus on specific pairs
- How professional participants (banks, hedge funds, central banks) think and move markets versus retail trader behavior
- Economic indicators and their real-time impact on currency valuations and trading decisions
- Risk management fundamentals: position sizing, stop-losses, and the relationship between leverage and account preservation
- Explain what a pip is, how bid-ask spreads affect your entry and exit, and why this matters for profitability on small moves
- If you use 10:1 leverage on a $10,000 account, what is your maximum position size, and what percentage move against you would wipe out your account?
- Describe the structure of the forex market: who are the major participants, and why is there no central exchange?
- How do the three major trading sessions (Asia, Europe, US) differ in liquidity and volatility, and which pairs are most active in each?
- What is the difference between the spot market and forwards/futures, and why would a professional trader choose one over the other?
- Name three economic indicators that move currency pairs, explain what they measure, and describe how a positive or negative reading affects a currency's value
- Create a reference sheet mapping 10 major currency pairs (EUR/USD, GBP/USD, USD/JPY, etc.) with their typical pip values, average daily ranges, and volatility profiles based on the books' examples
- Calculate position sizes for 5 different leverage scenarios (1:1, 5:1, 10:1, 20:1, 50:1) on a $10,000 account, showing maximum loss at 100 pips and 500 pips for each
- Track the bid-ask spread on 3 major pairs (EUR/USD, GBP/USD, USD/JPY) over one week using a live forex platform or simulator; calculate the cost of spreads on 10 hypothetical round-trip trades
- Write a one-page analysis of how a specific economic event (e.g., a central bank rate decision or employment report) moved a currency pair, identifying which professional participants likely drove the move
- Create a trading session calendar showing the overlap times between Asia, Europe, and US sessions; note which pairs are most liquid and volatile during each period
- Simulate 5 trades on a demo account using proper position sizing and stop-losses based on the risk management principles from both books; document your entry, exit, and reasoning
Next up: This stage builds the foundational mental model of how forex markets work and who moves them, preparing you to move into technical and fundamental analysis where you'll learn to identify *when* and *where* to enter and exit trades with higher probability.

Despite the title, this is a thorough, jargon-free map of the FX market — covering pairs, pips, spreads, leverage, and market sessions. It fills structural gaps quickly so intermediate readers aren't tripped up by forex-specific mechanics later.

Lien is a professional FX strategist and this concise book bridges market structure to actual trading logic — introducing macro drivers, carry trades, and short-term setups in plain language before deeper strategy books demand them.
Technical Analysis Applied to Forex
IntermediateBuild a robust technical toolkit — chart patterns, indicators, price action, and multi-timeframe analysis — calibrated specifically to the 24-hour FX market.
▸ Study plan for this stage
Pace: 6–8 weeks, ~40–50 pages/day (5–6 days/week). Murphy's comprehensive text (~600 pages) requires deliberate pacing to absorb chart pattern recognition, indicator mechanics, and multi-timeframe synthesis before applying to live FX markets.
- Dow Theory foundations: trend direction, support/resistance, and confirmation across timeframes — the bedrock of technical analysis in FX
- Chart patterns (head-and-shoulders, triangles, flags, double tops/bottoms) and their reliability in 24-hour forex markets with overlapping sessions
- Moving averages, oscillators (RSI, MACD, Stochastic), and volume analysis — how to select and combine indicators without over-optimization
- Price action and candlestick patterns: reading momentum, reversals, and continuation signals in real-time FX price movement
- Multi-timeframe analysis: aligning daily/4-hour/1-hour charts to confirm bias and filter false signals in volatile currency pairs
- Support and resistance zones: identifying key levels, understanding how price interacts with them, and using them as trade entry/exit anchors
- Trend identification and confirmation: distinguishing true trends from noise, using trendlines and channels to structure trading decisions
- Risk-reward geometry: measuring chart patterns and using technical levels to define stop-loss and take-profit placement
- What are the three tenets of Dow Theory, and how do they apply to confirming a trend in a currency pair across multiple timeframes?
- Describe the formation, characteristics, and failure modes of three major chart patterns (e.g., head-and-shoulders, triangles, flags). When is each most reliable in FX?
- How would you use moving averages and oscillators (RSI, MACD, Stochastic) together to filter entry signals and avoid whipsaws in a ranging market?
- What is the difference between support/resistance as static levels versus dynamic zones, and how does this distinction change your approach to FX trading?
- Walk through a multi-timeframe analysis: given a daily uptrend, how would you use 4-hour and 1-hour charts to identify a high-probability entry point and set a stop-loss?
- How do candlestick patterns and price action signals (e.g., pin bars, engulfing candles) confirm or contradict signals from traditional indicators?
- Chart pattern library: Over 2 weeks, collect and annotate 20–30 real FX charts (EUR/USD, GBP/USD, USD/JPY) showing completed head-and-shoulders, triangles, flags, and double tops. Label entry zones, stop-loss levels, and measure risk-reward ratios.
- Indicator tuning exercise: On a single currency pair (e.g., EUR/USD daily chart), test three different moving average combinations (e.g., 20/50/200, 10/30/100) and two oscillator setups (RSI + MACD vs. Stochastic + MACD). Document which combination generates the fewest false signals over a 3-month historical period.
- Multi-timeframe analysis journal: For 4 weeks, select one major pair daily. Analyze the daily chart (trend, support/resistance), then the 4-hour chart (momentum, patterns), then the 1-hour chart (entry signals). Write a 1-page analysis each day noting alignment or divergence across timeframes and your bias.
- Support/resistance mapping: On 5 different currency pairs, identify 8–10 key support and resistance levels using Murphy's methods (prior swing highs/lows, round numbers, moving averages). Track how price interacts with these levels over 2–3 weeks; note bounces, breaks, and retests.
- Candlestick pattern recognition drill: Using a charting platform, scan 50+ daily and 4-hour charts for pin bars, engulfing candles, and inside bars. Screenshot 15–20 examples and annotate what price action signal each suggests and how it aligns with the broader trend.
- Live chart annotation: For 1 week, annotate a live 4-hour EUR/USD chart daily, marking trendlines, moving averages, support/resistance, and oscillator signals. At day's end, note which signals were valid and which were false; review the next day to build intuition for pattern reliability.
Next up: This stage equips you with a visual and mechanical toolkit to read FX price action; the next stage will layer in risk management rules, position sizing, and trading psychology to transform technical signals into a disciplined, repeatable trading system.
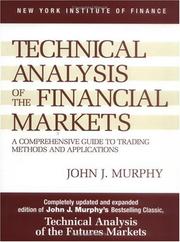
The canonical reference for technical analysis; reading it here gives the learner a complete, rigorous vocabulary of charts, trends, and indicators before applying them to forex-specific setups.
Volman applies pure price action — no indicators — to the EUR/USD with surgical precision. Reading Murphy first makes Volman's pattern logic immediately accessible and shows how TA principles translate into live FX execution.
Fundamental Analysis & Macro Strategy
IntermediateUnderstand how economic data, central bank policy, and global macro forces drive currency valuations, and learn to integrate fundamentals with technical signals.
▸ Study plan for this stage
Pace: 6–8 weeks, ~25–35 pages/day. Start with Lien's practical framework (weeks 1–3), then move to Soros's conceptual depth (weeks 4–8). Allocate 2–3 days per week for market observation and paper trading.
- Economic indicators and their direct impact on currency pairs: GDP, inflation, employment, interest rate differentials, and trade balances
- Central bank policy cycles, forward guidance, and how monetary policy surprises move FX markets
- Carry trade mechanics and interest rate parity as drivers of long-term currency trends
- Reflexivity and feedback loops: how market participants' expectations influence economic outcomes and currency valuations
- Macro narrative construction: identifying dominant themes (risk-on/risk-off, commodity cycles, geopolitical shifts) that drive multi-week to multi-month trends
- Integration of fundamental analysis with technical signals: using macro thesis to filter technical setups and avoid whipsaws
- Position sizing and risk management in macro-driven markets with asymmetric payoff structures
- How do changes in interest rate differentials between two countries affect currency valuations, and what role does the carry trade play in amplifying these moves?
- What is reflexivity in Soros's framework, and how does it explain why currency trends can persist longer than fundamental valuations alone would predict?
- How would you use economic calendar data (from Lien's approach) to anticipate central bank policy shifts, and what are the most market-moving indicators for major currency pairs?
- Describe a macro narrative: pick a real or hypothetical scenario (e.g., Fed tightening vs. ECB easing) and explain how it would affect EUR/USD over 3–6 months, integrating both fundamental and technical perspectives.
- What are the risks of relying solely on fundamental analysis without technical confirmation, and how does Lien's swing-trading framework mitigate these risks?
- How would you construct a position in a currency pair if your macro thesis is correct but the technical setup is weak, and what does position sizing tell you about conviction?
- Track 5–7 key economic indicators (NFP, CPI, central bank rate decisions, GDP) for your two most-traded pairs over 4 weeks. Document the announcement, the market's pre-announcement expectation, the actual release, and the 1-hour and 4-hour price reaction. Identify which indicators move your pairs most consistently.
- Build a macro thesis for one major pair (e.g., EUR/USD, GBP/USD, USD/JPY) for the next 6 weeks. Write a one-page summary covering: current interest rate differential, central bank policy stance, inflation outlook, and geopolitical factors. Update it weekly and compare your thesis to actual price action.
- Paper-trade 3–5 swing trades using Lien's technical framework (support/resistance, moving averages, momentum) but only enter trades that align with your macro thesis. Document your conviction level (1–10) for each trade and track whether trades with higher macro conviction have better risk-reward outcomes.
- Analyze a historical currency trend (e.g., USD strength 2014–2016, EUR weakness 2010–2012) using Soros's reflexivity lens. Identify the initial macro catalyst, the feedback loop that amplified the move, and the inflection point where reflexivity reversed. Compare this narrative to Lien's technical markers of trend exhaustion.
- Create a 'macro calendar' for the next 8 weeks: list all major economic releases, central bank meetings, and geopolitical events for your traded pairs. For each event, write a 2–3 sentence prediction of the likely outcome and its FX impact. After the event, grade your prediction accuracy.
- Conduct a position-sizing exercise: assume you have a macro thesis with 65% conviction and a technical setup with a 1.5:1 reward-to-risk ratio. Using Lien's risk management principles, calculate your position size as a percentage of account equity. Then model what happens if the trade moves 2R against you before reversing—does your conviction level justify the drawdown?
Next up: This stage equips you with the macro-fundamental toolkit and reflexivity mindset to identify multi-week to multi-month trends; the next stage will teach you to execute these theses with advanced technical precision, volatility management, and portfolio-level hedging strategies.

Lien's flagship trading book systematically covers interest rate differentials, economic indicators (NFP, CPI, GDP), and central bank rhetoric — the core fundamental drivers every FX trader must track.

Soros's reflexivity framework explains how market participants' beliefs feed back into currency prices — essential macro intuition for understanding why fundamentals can diverge from price for extended periods.
Risk Control, Psychology & Trading Discipline
ExpertMaster position sizing, risk-reward frameworks, drawdown management, and the psychological discipline required to execute a forex strategy consistently over time.
▸ Study plan for this stage
Pace: 8–10 weeks, ~40–50 pages/day. Week 1–3: Trading in the Zone (350 pages). Week 4–5: Van Tharp's Position Sizing (200 pages). Week 6–10: Market Wizards (400 pages) with weekly review and integration sessions.
- The Disciplined Trader mindset: separating emotions from trading decisions and developing belief in your edge
- Risk-reward ratios and expectancy calculations: how to quantify whether a trade setup is worth taking
- Position sizing methodologies: fixed fractional, optimal f, and volatility-based approaches to determine contract/lot size
- Drawdown management and equity curves: understanding maximum acceptable loss and recovery strategies
- Psychological patterns in trading: fear, greed, overconfidence, and how top traders overcome them
- Consistency and rule-based execution: the discipline to follow your system regardless of recent wins or losses
- Real-world trader interviews and case studies: learning from Market Wizards how elite traders apply these principles in practice
- What is the relationship between your trading beliefs, emotional state, and decision-making, and how does Mark Douglas argue you should restructure your thinking to trade in the zone?
- How do you calculate expectancy for a trading system, and why is a positive expectancy insufficient without proper position sizing?
- Explain the difference between fixed fractional position sizing and optimal f, and when you would use each approach in your own trading plan.
- What is a maximum acceptable drawdown, and how should it inform your position size and risk per trade?
- Identify three psychological obstacles that Market Wizards traders mention facing, and describe the specific discipline or technique each used to overcome them.
- How would you design a position sizing rule that accounts for both your account size and current market volatility, based on Van Tharp's framework?
- Complete the 'Belief Audit' from Trading in the Zone: write down your core beliefs about money, risk, and losing trades, then identify which beliefs are limiting your discipline.
- Calculate the expectancy of a trade setup you've researched: define win rate, average win, average loss, and compute whether the risk-reward justifies taking the trade.
- Build a position sizing spreadsheet using Van Tharp's fixed fractional method: input your account size, risk per trade (1–2%), and calculate the contract/lot size for 10 different trade scenarios.
- Backtest your trading system and plot the equity curve: identify the largest drawdown, calculate the maximum acceptable drawdown as a percentage, and adjust your position size accordingly.
- Select three Market Wizards interviews and extract the psychological discipline or risk-control rule each trader emphasizes; write a one-page summary of how you will apply one of these to your own trading.
- Paper trade for 2 weeks using strict position sizing rules from Van Tharp: log every trade with entry, exit, position size, and whether you followed your rule; review for consistency.
Next up: This stage equips you with the psychological foundation and quantitative frameworks to execute any trading strategy with discipline and proper risk management—preparing you to move into advanced strategy development, market analysis, and specialized trading techniques where you can apply these principles to specific currency pairs and timeframes.
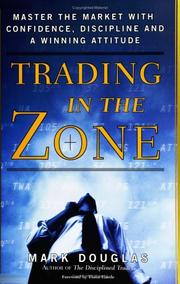
The definitive book on trading psychology; placed here so the learner confronts the mental game only after they have a real strategy to apply it to — making every concept immediately practical.

Tharp proves mathematically that position sizing — not entry signals — is the primary driver of long-term performance. This book provides the quantitative risk-control framework that ties the entire curriculum together.

Interviews with elite traders reveal the real-world synthesis of strategy, risk management, and discipline. Reading this last shows the learner how all the preceding concepts are integrated by professionals who trade for a living.
Discussion
Keep reading
Paths that share books, cover the same subject, or open a related topic.