Best Books on Inventory Management, in Order
This curriculum builds from core inventory management principles up to advanced quantitative techniques, tailored for an intermediate learner who already understands basic supply chain concepts. Each stage sharpens a specific layer of mastery — from foundational models and demand forecasting, through safety stock and reorder optimization, to cost reduction and strategic ABC-driven decision-making — so that every book reinforces and extends the one before it.
Solidifying the Foundations
IntermediateEstablish a rigorous shared vocabulary for inventory systems, understand the core trade-offs (holding vs. ordering vs. stockout costs), and get comfortable with the EOQ model and its extensions before layering in more advanced techniques.
▸ Study plan for this stage
Pace: 6–8 weeks, ~40–50 pages/day with 2–3 days/week for problem sets and review
- Inventory cost structure: holding costs, ordering costs, stockout costs, and their interrelationships
- Economic Order Quantity (EOQ) model derivation, assumptions, and interpretation of the optimal order quantity
- Demand patterns and forecasting fundamentals as inputs to inventory decisions
- Reorder point (ROP) and safety stock calculations under deterministic and stochastic demand
- Service level metrics (fill rate, cycle service level) and their role in balancing stockout risk and holding costs
- Extensions to the basic EOQ: quantity discounts, production lot sizing (EPL), and multi-item constraints
- ABC analysis and inventory classification for prioritizing management effort
- Inventory system types (continuous review vs. periodic review) and their operational implications
- What are the three primary cost components in inventory systems, and how does the EOQ model balance them?
- How do you calculate the Economic Order Quantity, and what assumptions must hold for it to be valid?
- What is the difference between cycle service level and fill rate, and when would you use each metric?
- How do you determine reorder point and safety stock when demand is stochastic, and what role does service level play?
- How do quantity discounts and production constraints modify the EOQ decision, and how do you solve for the optimal order quantity in these cases?
- What is ABC analysis, and how should it influence your inventory management strategy across different product categories?
- Calculate EOQ for a real or hypothetical product using Silver's framework; verify the result by computing total annual cost at the optimal quantity and at nearby integer values
- Build a sensitivity analysis: vary holding cost, ordering cost, and demand in the EOQ formula and observe how the optimal order quantity and total cost change
- Solve a reorder point problem with stochastic demand: given demand distribution and a target service level, calculate ROP and safety stock, then interpret the results
- Work through a quantity discount scenario: compare total costs across multiple price breaks and identify the optimal order quantity when unit cost decreases with volume
- Perform ABC analysis on a multi-item inventory dataset (10–20 SKUs): classify items by annual dollar usage, then propose differentiated management strategies for each class
- Compare continuous review (Q, R) and periodic review (T, S) systems for the same product: calculate order quantities and review intervals, and discuss trade-offs in implementation
Next up: This stage equips you with the analytical tools and shared language to model inventory trade-offs rigorously, positioning you to tackle advanced topics such as multi-echelon networks, dynamic programming approaches, and demand-driven strategies (e.g., just-in-time and vendor-managed inventory) in the next stage.
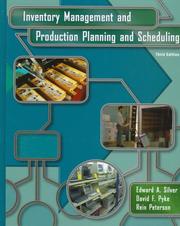
The definitive academic-yet-practical textbook on inventory management. Reading it first gives you the precise mathematical language — EOQ, reorder points, cycle stock — that every subsequent book assumes you know.
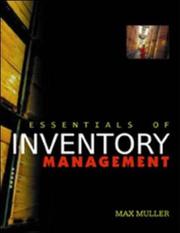
A concise, practitioner-focused companion that translates the theory into warehouse-floor reality, covering ABC analysis and carrying costs in plain language — ideal for bridging academic models to day-to-day decisions.
Mastering Demand Forecasting
IntermediateUnderstand how demand uncertainty drives every inventory decision, learn the major forecasting methods (moving averages, exponential smoothing, regression), and know how to measure and manage forecast error.
▸ Study plan for this stage
Pace: 4–5 weeks, ~40–50 pages/day. Start with Chase's "Demand-Driven Forecasting" (weeks 1–2, ~200 pages), then move to Hyndman's "Forecasting" (weeks 3–5, ~250+ pages). Allocate 2–3 days per week for hands-on exercises and method comparisons.
- Demand uncertainty as the root driver of inventory costs, safety stock, and bullwhip effects
- Moving averages (simple, weighted, exponential smoothing) and when to apply each based on demand patterns
- Exponential smoothing variants (SES, Holt's, Holt-Winters) for trend and seasonality
- Regression and causal forecasting methods to incorporate external drivers (price, promotions, market conditions)
- Forecast error metrics (MAE, RMSE, MAPE, bias) and their role in setting safety stock and reorder points
- Demand patterns: stationary, trend, seasonal, and irregular components
- Forecast accuracy improvement through model selection, ensemble methods, and error monitoring
- Practical implementation: choosing methods based on data availability, lead time, and business context
- How does demand uncertainty translate into inventory holding costs, stockout risks, and supply chain inefficiency?
- When would you use simple moving average vs. exponential smoothing, and what are the trade-offs?
- How do you detect and handle trend and seasonality in demand data, and which Hyndman methods address these?
- What is forecast error, how do you measure it (MAE, RMSE, MAPE), and how does it inform safety stock calculations?
- How can regression or causal models improve forecasts when demand is driven by external factors like price or promotions?
- What is the bullwhip effect, and how does forecast accuracy reduce it across the supply chain?
- Build a simple moving average forecast (3, 6, 12-month windows) on a real or simulated demand dataset; compare accuracy metrics and discuss lag effects
- Implement exponential smoothing (SES) with different smoothing constants (α = 0.1, 0.3, 0.7) on the same dataset; plot forecasts and explain sensitivity to α
- Fit a Holt-Winters model to seasonal demand data (e.g., retail, energy); decompose into level, trend, and seasonal components
- Run a regression forecast using external variables (e.g., price, marketing spend, competitor activity); compare R² and residuals to naive/exponential smoothing
- Calculate MAE, RMSE, and MAPE for 2–3 competing models on a holdout test set; determine which metric best aligns with your business cost structure
- Design a safety stock policy based on forecast error (e.g., z-score × forecast std dev); simulate inventory levels and stockout frequency under different error scenarios
Next up: This stage equips you with the forecasting foundation—accurate demand signals and error quantification—that directly feeds into the next stage's focus on optimal inventory policies, reorder points, and lot-sizing decisions.

Focuses specifically on statistical demand forecasting in a supply chain context, covering forecast error metrics and how to feed forecast outputs directly into inventory replenishment logic.

The most rigorous and widely used modern forecasting text; read after Chase to deepen your statistical toolkit — exponential smoothing, ARIMA, and seasonality decomposition — all directly applicable to SKU-level demand.
Safety Stock, Reorder Points & Replenishment Optimization
IntermediateCalculate safety stock and reorder points under real-world demand and lead-time variability, select the right service-level targets, and design replenishment policies that balance cost against availability.
▸ Study plan for this stage
Pace: 6–8 weeks, ~40–50 pages/day (Chopra first: 2–3 weeks on relevant chapters; Sherbrooke: 3–4 weeks for deeper modeling and optimization)
- Safety stock as a buffer against demand and lead-time uncertainty, and the trade-off between holding costs and stockout risk
- Reorder point (ROP) calculation under variable demand and lead time: ROP = (average demand × average lead time) + safety stock
- Service-level targets (cycle service level vs. fill rate) and their impact on safety stock requirements
- Optimal replenishment policies: continuous review (Q, R) systems and periodic review systems, with cost minimization objectives
- Lead-time demand distribution and its role in determining safety stock via service-level factors (z-scores)
- Inventory holding, ordering, and stockout costs as drivers of replenishment decisions
- Multi-echelon inventory optimization and the impact of variability at different supply chain stages
- Practical implementation: translating theoretical models into actionable reorder points and order quantities for real operations
- How do you calculate safety stock when both demand and lead time are variable, and what role does the service-level target play?
- What is the difference between cycle service level and fill rate, and when should you use each metric?
- How do you determine the reorder point in a continuous review system, and what happens if you set it too high or too low?
- Compare and contrast continuous review (Q, R) and periodic review replenishment policies in terms of implementation complexity and cost effectiveness
- Given a specific demand distribution, lead-time variability, and cost structure, how would you design an optimal replenishment policy?
- How does variability at upstream supply chain stages (e.g., supplier lead time) propagate downstream, and what does this mean for safety stock decisions?
- Using data from Chopra's supply chain case studies, calculate safety stock and ROP for a real product with normally distributed demand and variable lead times; compare results at different service levels (90%, 95%, 99%)
- Build a spreadsheet model implementing the (Q, R) continuous review system from Sherbrooke; vary demand volatility and lead time to observe how safety stock and total cost change
- Design a periodic review replenishment policy for a slow-moving SKU; calculate the order-up-to level and compare total costs against a continuous review approach
- Analyze a multi-product inventory scenario (e.g., from Chopra) and allocate a fixed safety stock budget across items to maximize service level; justify your allocation using Sherbrooke's optimization principles
- Conduct a sensitivity analysis: starting with a baseline ROP, test how changes in lead-time variability, demand volatility, and holding costs affect optimal order quantity and safety stock
- Implement Sherbrooke's METRIC model (or a simplified version) to optimize inventory at multiple echelons; calculate the impact of reducing lead-time variability at one stage on total system inventory
Next up: This stage equips you with the quantitative tools and decision frameworks to set reorder points and safety stock levels; the next stage will extend these foundations to multi-item optimization, demand forecasting integration, and dynamic replenishment strategies that respond to changing market conditions.

Chopra's treatment of cycle stock, safety stock, and the newsvendor model is the clearest available at this level; it ties service levels directly to financial trade-offs, building the intuition needed for the next book.
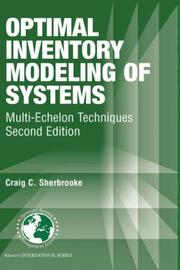
Dives deep into multi-echelon safety stock and reorder-point optimization; best read after Chopra because it demands comfort with probabilistic service-level framing that Chopra establishes.
ABC Analysis, Segmentation & Carrying Cost Reduction
ExpertApply ABC/XYZ segmentation to prioritize inventory policies by SKU, identify and systematically attack the components of carrying cost (capital, obsolescence, storage), and implement lean thinking to free up working capital.
▸ Study plan for this stage
Pace: 6–8 weeks, ~40–50 pages/day (accounting for dense supply chain concepts and case studies)
- ABC/XYZ segmentation matrix: classifying SKUs by value (A/B/C) and demand variability (X/Y/Z) to tailor inventory policies
- Carrying cost decomposition: capital cost, obsolescence risk, and storage/handling costs as levers for working capital reduction
- Lean principles applied to inventory: eliminating waste, reducing batch sizes, and right-sizing safety stock
- Pull systems vs. push systems: how lean logistics minimizes inventory buildup and improves flow
- Value stream mapping for inventory: identifying non-value-adding inventory and cost drivers across the supply chain
- Economic order quantity (EOQ) and batch size optimization under lean constraints
- Obsolescence management: demand forecasting accuracy and product lifecycle planning to reduce write-offs
- Continuous improvement culture: kaizen and gemba walks to sustain inventory reduction initiatives
- How would you classify your company's top 100 SKUs using ABC/XYZ segmentation, and what inventory policy would you recommend for each quadrant?
- Break down the carrying cost for a high-value, slow-moving item: what are the capital, obsolescence, and storage components, and which lever offers the biggest reduction opportunity?
- Explain the difference between a push and pull system, and describe how Toyota's approach (from The Machine That Changed the World) minimizes inventory through pull logic
- Design a value stream map for a product family: identify where inventory accumulates, quantify non-value-adding time, and propose lean interventions
- What role does demand forecasting accuracy play in reducing obsolescence and carrying costs? How would you measure and improve it?
- How would you use kaizen and gemba walks to engage the team in identifying and eliminating inventory waste in your operation?
- ABC/XYZ segmentation project: Obtain 3–6 months of sales and inventory data from your company (or a case study). Classify 50+ SKUs into the 9-cell matrix; calculate average inventory levels and stockout rates by cell; propose differentiated reorder points and safety stock levels for each segment.
- Carrying cost audit: Select 5 SKUs across different segments (A-high value, C-low value, etc.). Gather data on: unit cost, annual holding rate (%), storage space used, obsolescence history. Calculate total carrying cost; break it down by component; identify the top 2–3 cost drivers and brainstorm reduction tactics.
- Value stream mapping exercise: Map the current state of a product family from supplier to customer, showing inventory buffers, lead times, and batch sizes. Identify non-value-adding inventory; calculate total cycle time and inventory turns. Design a future-state map incorporating pull logic and smaller batches; estimate working capital savings.
- Lean batch size analysis: Take a high-volume SKU with current batch size Q. Calculate EOQ under standard assumptions; then recalculate assuming lean constraints (setup time reduction, smaller lot sizes). Compare inventory levels, carrying costs, and cash-to-cash cycle time.
- Demand forecasting accuracy study: Analyze 12–24 months of actual demand vs. forecasts for 3–5 SKUs. Calculate forecast error (MAPE); correlate error with obsolescence write-offs and excess inventory. Propose process improvements (e.g., collaborative forecasting, shorter planning horizons) and quantify impact.
- Gemba walk and kaizen event: Conduct a 2–3 hour gemba walk in your warehouse or production area with a cross-functional team. Observe inventory handling, identify 5–10 waste sources (overproduction, waiting, excess motion). Run a 1-day kaizen to prototype and test one quick-win solution (e.g., reorganizing a slow-moving section, reducing reorder point for a fast mover).
Next up: This stage equips you to segment inventory strategically and attack carrying costs at the component level; the next stage will deepen your ability to optimize the entire supply chain network—from supplier collaboration and demand planning to distribution and last-mile efficiency—using the lean mindset you've internalized here.

Directly addresses how ABC segmentation drives differentiated replenishment strategies and how lean principles — pull systems, reduced lot sizes — cut carrying costs without sacrificing service levels.

The foundational text on lean thinking; reading it here — after the quantitative tools are in place — reframes inventory as waste and gives the strategic motivation to relentlessly pursue carrying-cost reduction.
Integrated Mastery & Advanced Practice
ExpertSynthesize all prior learning into an end-to-end inventory strategy: connect forecasting accuracy to safety stock levels, tie ABC segmentation to financial KPIs, and benchmark your system against world-class operations.
▸ Study plan for this stage
Pace: 8–10 weeks, ~40–50 pages/day, with 2–3 days per week dedicated to synthesis exercises and case study work
- End-to-end inventory strategy: connecting demand forecasting accuracy to safety stock determination and service level targets
- ABC segmentation logic applied to financial impact: linking inventory classification to working capital optimization and ROI
- Integrated metrics framework: translating operational inventory decisions (reorder points, lot sizes, service levels) into financial KPIs (inventory turns, cash-to-cash cycle, carrying cost ratios)
- Demand variability and forecast error quantification: using standard deviation and coefficient of variation to set appropriate safety stock levels across product segments
- World-class benchmarking: identifying performance gaps in your current system against industry standards and best-in-class operations
- Trade-offs between service level, inventory investment, and operational complexity: making data-driven decisions on which products warrant higher safety stock or more frequent replenishment
- Supply chain visibility and control: using metrics to monitor and adjust inventory policies in real time across the network
- Sustainability and financial alignment: balancing inventory reduction goals with service level commitments and supply chain resilience
- How do you determine the appropriate safety stock level for a given product, and how does forecast accuracy directly influence that calculation?
- Explain how ABC segmentation should drive different inventory policies (reorder points, service levels, review frequencies) and how this connects to overall supply chain profitability.
- What are the key metrics that link inventory management decisions to financial performance, and how would you use them to justify an inventory reduction initiative?
- How would you benchmark your organization's inventory performance against world-class operations, and what gaps would you prioritize closing first?
- Describe a scenario where increasing safety stock for a critical SKU actually improves financial KPIs—what conditions make this true?
- How do you design an integrated inventory strategy that balances demand variability, supply lead time uncertainty, and service level targets across multiple product segments?
- Build a complete safety stock model for 3–5 real or realistic SKUs: calculate forecast error, determine appropriate service levels by ABC class, and compute the resulting safety stock quantities; validate against Silver's formulas.
- Conduct a full ABC segmentation analysis on a dataset of 50+ SKUs using revenue, volume, and criticality; assign differentiated inventory policies to each segment and estimate the financial impact (working capital freed, carrying cost reduction).
- Create a metrics dashboard that connects 5–7 operational inventory metrics (inventory turns, days inventory outstanding, fill rate, forecast accuracy) to 3–4 financial KPIs (cash-to-cash cycle, inventory carrying cost as % of revenue, ROI on inventory investment); track changes over a simulated quarter.
- Perform a benchmarking exercise: gather industry data or use case studies from Cecere's book to identify your organization's performance gaps in inventory turns, service levels, and forecast accuracy; develop a prioritized roadmap to close top 3 gaps.
- Design an integrated replenishment policy for a product family: specify reorder points, order quantities, review frequencies, and service levels; document the trade-offs made and the financial justification for each decision.
- Simulate the impact of a 10% improvement in forecast accuracy on safety stock levels, working capital, and service levels across your ABC segments; present findings to a hypothetical executive audience.
Next up: This stage equips you to lead strategic inventory transformation initiatives and defend inventory decisions with financial rigor, preparing you to either specialize in advanced topics (e.g., network optimization, multi-echelon inventory systems) or transition to implementing and sustaining these strategies in a real operational environment.

The fully updated fourth edition of Silver's classic, this capstone text integrates demand forecasting, multi-item ABC prioritization, safety stock models, and cost optimization into a single coherent framework — the ideal synthesis read.

Closes the curriculum by connecting every technical concept — forecast error, inventory turns, carrying cost — to measurable financial outcomes and benchmarks, teaching you how to evaluate and continuously improve your own inventory system.
Discussion
Keep reading
Paths that share books, cover the same subject, or open a related topic.