Best Books on Human Factors and Ergonomics, in Reading Order
Human factors is the discipline that treats the mismatch between a machine and the person operating it as an engineering defect rather than a user failing. This path opens with Norman and the design classics that make that idea impossible to unsee, moves into the standard undergraduate textbooks by Wickens and by Sanders and McCormick, then splits into the physical side — anthropometry and workplace layout — and the cognitive side of workload, attention and display design, finishing with the methods and reference works practitioners actually work from.
Seeing the mismatch
BeginnerLearn to look at any door, dashboard or dialog box and articulate precisely why it fails its user, using affordances, mappings, feedback and constraints.
▸ Study plan for this stage
Pace: 3–4 weeks for 772 pages at ~30 pages/day. No prerequisites — these are trade books and Norman in particular reads in a few evenings. The stage is short by design; the value comes from doing the observation exercises rather than from the page count.
- Affordance as Norman uses it: the perceived action possibilities of an object, and the distinction he later drew between real and perceived affordances after the term was widely misused
- Natural mapping — controls arranged in the same spatial relationship as the things they control, which is why the four-burner stove is the field's most famous worked example
- Feedback and its absence: the user must be told that the system registered the action, and Norman's argument that most 'user error' is unsignalled state
- Constraints and forcing functions — physical, semantic, cultural and logical — which make the wrong action impossible rather than merely discouraged
- The gulfs of execution and evaluation: the distance between what the user wants to do and the available controls, and between the system state and the user's ability to perceive it
- Slips versus mistakes: an error in executing a correct intention versus a correct execution of a wrong intention, which require entirely different design responses
- Dreyfuss's founding move in 1955 — putting measured human bodies at the centre of industrial design, and the Joe and Josephine figures that became the field's anthropometric convention
- Johnson's bridge: each of Norman's rules restated as a consequence of a specific perceptual or memory limit, which is what makes the rules predictive rather than stylistic
- Define affordance, mapping, feedback and constraint, and give a physical example of each from an object within arm's reach right now.
- Explain the gulf of execution and the gulf of evaluation, and give a device that fails at each.
- What is the difference between a slip and a mistake? Give one of each from your own experience, and say what design change would prevent each.
- Take one of Johnson's perceptual findings and show how it explains a Norman design rule that Norman himself justified by intuition.
- What did Dreyfuss actually change about industrial design practice in the 1950s, and what does his approach assume about human variation?
- Photograph ten badly designed objects you encounter over a week — doors, taps, hobs, lift panels, remote controls, interfaces — and for each write one sentence naming which of Norman's principles it violates and what the fix would be.
- Redesign one interface you use daily, in a sketch, and annotate every change with the principle that justifies it. Sketching by hand is enough; the annotation is the exercise.
- Find a real stove or hob with a non-natural burner mapping and draw the control panel as it is, then redraw it with a natural mapping. This is the field's canonical exercise and it takes ten minutes.
- Keep an error log for a fortnight: every time you get something wrong with a device, record whether it was a slip or a mistake and what the system did or failed to signal.
- Pick one of Johnson's chapters and write a page linking its perceptual research to two specific design decisions in a product you own.
Next up: Norman's vocabulary is used unexplained by every textbook ahead; the next stage puts it inside the formal discipline with its measurements, models and standards.

The book that made human-centred design a public idea. Norman's vocabulary — affordance, mapping, forcing function, gulf of execution — is used unexplained by every later text on this path, so it genuinely has to come first.
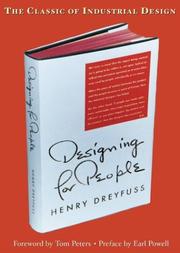
The 1955 origin of the field, by the industrial designer who first put measured human bodies at the centre of product design. Read second for the historical spine, and because his anthropometric work returns in stage three.

Connects Norman's design rules to the perceptual and memory research that explains them. A short, evidence-first bridge from intuition into the textbooks.
The core textbooks
IntermediateCover the formal discipline end to end — sensory capabilities, information processing, controls and displays, workload, anthropometry, environment and safety — at the level a human factors course would demand.
▸ Study plan for this stage
Pace: 6–8 months for 1,363 textbook pages — this is the largest commitment on the path and should be worked, not read. Wickens first at ~10 pages/day with the end-of-chapter problems, then Sanders and McCormick at the same rate. Prerequisites, stated honestly: introductory statistics (means, standard devi
- The human as an information-processing system: sensation, perception, working memory, decision, response selection and execution, with a measurable capacity limit at each stage
- Sensory capabilities as design constraints: visual acuity, contrast sensitivity, colour vision limits, auditory masking and thresholds, and how each converts into a display specification
- Display design principles — proximity compatibility, the moving part principle, pictorial realism, redundancy gain — and the conditions under which each applies
- Control design: compatibility of control and display movement, population stereotypes, coding by shape, size, colour and location, and the design of controls that resist inadvertent operation
- Hick–Hyman law and Fitts's law as the two quantitative laws every human factors engineer must be able to apply, and their limits
- Human error taxonomies and Reason's distinction between active failures and latent conditions, plus the systems view of accident causation
- Automation and its human costs: mode confusion, out-of-the-loop performance decrement, complacency and trust calibration
- The physical and environmental factors Sanders and McCormick treat at length — noise, vibration, illumination, thermal conditions, shift work — with their exposure standards
- State Fitts's law, define every term, and use it to predict which of two button layouts will be faster. Show the calculation.
- State the Hick–Hyman law and explain why adding options to a menu costs time logarithmically rather than linearly.
- Explain the proximity compatibility principle and give a display that violates it and one that satisfies it.
- What is a population stereotype for control movement, and give two that differ between countries or industries. What does that imply for export design?
- Distinguish active failures from latent conditions using a real accident you know, and identify two latent conditions that were present for years beforehand.
- Explain the out-of-the-loop performance decrement and why more reliable automation can make the human operator worse rather than better.
- Work the end-of-chapter problems in Wickens's chapters on displays, controls and information processing, showing all working. Check each answer by dimensional analysis — a reaction time that comes out in bits has a lost term.
- Reproduce a worked Fitts's law example from the text with different numbers: your own screen, your own target sizes and distances. Then measure yourself with a stopwatch on twenty trials and compare the predicted and observed movement times.
- Take a real control panel — a car dashboard, a cooker, a machine at work — and evaluate it systematically against the display and control principles in Wickens, writing one line per principle with a pass or fail.
- Using the illumination, noise and thermal chapters in Sanders and McCormick, measure the actual conditions at one workstation with whatever instruments you have (a phone light meter and sound meter are adequate) and compare each with the recommended range.
- Build your own summary sheet of every quantitative relationship in the two textbooks — Fitts, Hick–Hyman, signal detection basics, NIOSH lifting, decibel arithmetic — with the equation, the units and one worked example each.
- Take one accident report published by a national transport safety board and analyse it using the error taxonomy from Wickens, identifying active failures and latent conditions separately.
Next up: With the discipline covered in outline, the path now splits: this stage is the physical body and its measurement, and the next is cognition and formal method.
The standard first textbook and the most readable of the two: system design, cognition, displays, controls, automation and error in one coherent sequence. Take it before Sanders and McCormick.
The older, broader reference text, stronger on physical work, environment and industrial settings than Wickens. Read as the complement — where Wickens is brisk, this is comprehensive.
The physical human
IntermediateDesign workstations, controls and reach envelopes for real bodies across a population, and reason quantitatively about posture, force, repetition and musculoskeletal risk.
▸ Study plan for this stage
Pace: 4–5 months for 1,014 pages. Bridger at ~12 pages/day because the biomechanics chapters need working through with a pencil; Pheasant and Haslegrave more slowly still, since the point is to use the tables rather than read them; Tilley's 104 pages are a data book to be consulted. Prerequisites: statist
- Anthropometric data as distributions, not numbers: percentile values, the use of the 5th and 95th percentile as design limits, and the fact that percentiles do not add across dimensions
- The mythical average person — the single most consequential error in the field, and why designing for the 50th percentile fits almost nobody
- Design-for-extremes, design-for-adjustability and design-for-average as three distinct strategies with different applicability, and how to choose between them
- Clearance dimensions set by the large user and reach dimensions set by the small user, which is why one cockpit needs both tails of the distribution
- Biomechanics of posture and load: moments about the spine, compressive force at L5/S1, and why a load held at arm's length is far worse than the same load held close
- The NIOSH lifting equation and its multipliers — horizontal, vertical, distance, asymmetry, frequency, coupling — as a worked quantitative risk assessment rather than a rule of thumb
- Work-related musculoskeletal disorder risk factors: force, repetition, posture, duration and vibration, and the assessment tools built on them
- Secular trend and population variation — anthropometric tables age, and data from one national population does not transfer to another
- Why can you not add 95th percentile stature to 95th percentile arm length to get a 95th percentile reach? Explain in terms of correlation between dimensions.
- For a doorway, a shelf and an adjustable chair, state which design strategy applies and which percentile governs each dimension.
- Compute the compressive load at L5/S1 for a person holding a 15 kg load at 30 cm and at 60 cm from the spine. Show the moment arithmetic and explain the ratio.
- Work a full NIOSH lifting equation for a specified task and interpret the lifting index. What does an index above 1 actually mean?
- Which anthropometric population do Pheasant's tables describe, and what would you have to do to apply them to a different population?
- What are the five main physical risk factors for musculoskeletal disorders, and which are additive and which multiplicative in the assessment tools?
- Design a real workstation to specification: measure the task, choose the governing percentiles, take the dimensions from Pheasant or Tilley, and produce a dimensioned drawing with a written justification for every number.
- Work all the biomechanics problems in Bridger's manual handling chapters with a calculator, and check each result by dimensional analysis and by order of magnitude — a spinal compressive force of 40 N is off by three orders.
- Take one real lifting task and compute its NIOSH recommended weight limit and lifting index, then redesign the task to bring the index below 1 and recompute. Show both calculations.
- Measure ten people you know for three dimensions — stature, sitting eye height, functional reach — and compare the spread with the published percentiles. The exercise makes the distribution real.
- Evaluate your own desk against Bridger's seated workstation criteria, dimension by dimension, then adjust it and record the changes. Anything you cannot fix, note as a design constraint.
- Reproduce a worked posture assessment (RULA or REBA as covered in Bridger) on a photograph of a real working posture, scoring each element, then repeat it after a proposed change.
Next up: Bodies are the tractable half of the discipline; the last stage takes the cognitive half quantitatively and adds the methods used to assess real systems.
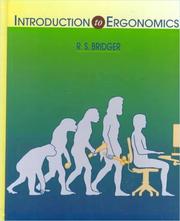
The clearest treatment of physical ergonomics — biomechanics, posture, manual handling and workstation design — with enough physiology to justify its recommendations rather than merely listing them.
The standard work on anthropometry and how to apply percentile data without designing for a mythical average person. Read after Bridger, whose framing makes the tables meaningful.
The Dreyfuss Associates data set in its modern form: the drawings and dimensions designers actually reach for at the drafting stage. The practical payoff of everything in this stage.
Cognition, methods and the reference shelf
IntermediateModel attention, memory and workload rigorously enough to predict operator performance, and choose and run the right analysis method — task analysis, workload assessment, error prediction — for a real system.
▸ Study plan for this stage
Pace: 8–12 months, and treat it as a graduate-level undertaking rather than a reading stage. Wickens and Hollands at ~8 pages/day worked with a notebook; Stanton as a methods manual you read once through and then use; the Salvendy Handbook is 1,680 pages of specialist chapters to be consulted, never read
- Signal detection theory: hits, misses, false alarms and correct rejections; d-prime as a measure of sensitivity independent of criterion; beta and the criterion shift produced by payoffs and probabilities
- Multiple resource theory: the dimensions along which tasks compete (stages, modalities, codes, visual channels) and its use in predicting which task pairs can be time-shared
- Mental workload as a construct with three families of measure — subjective, performance-based and physiological — and the dissociations between them
- Situation awareness: Endsley's three levels, the measurement approaches, and the standing theoretical dispute about whether it is a useful construct at all
- Hierarchical task analysis as the foundational method on which most others are built — goals, subgoals, operations and plans
- SHERPA and related human error identification techniques: systematically enumerating credible errors at each task step and their consequences
- NASA-TLX and SWAT as workload instruments, with their administration procedures, scaling and known limitations
- How to select a method: what question is being asked, what data are obtainable, what the method costs to run, and what its reliability and validity evidence actually is
- Given a table of hits and false alarms, compute d-prime and the criterion. Show the z-score arithmetic and interpret both numbers.
- An operator's false alarm rate is high and hit rate is high. Is this a sensitivity or a criterion problem, and what intervention follows?
- State multiple resource theory's dimensions and use it to predict which of two concurrent task pairs will interfere more. Justify from the model, not intuition.
- Why can subjective and performance-based workload measures dissociate? Give a scenario in which they point in opposite directions.
- Define Endsley's three levels of situation awareness and describe how each is measured. What is the main theoretical objection to the construct?
- For a given system, choose one method from Stanton for task description, one for error prediction and one for workload, and justify each choice on the grounds of question, data and cost.
- Derive d-prime from a full set of signal detection data by hand, then repeat it for three different criterion settings on the same underlying sensitivity, and plot the resulting ROC curve. Doing this once makes the whole framework usable.
- Work the quantitative problems in the Wickens and Hollands chapters on signal detection, attention and workload, checking each with a sanity estimate before you trust the arithmetic.
- Conduct a full hierarchical task analysis of a real task — making a cup of coffee is the traditional starting point, but use a genuine work task if you have one — down to at least four levels, with plans at every node.
- Apply SHERPA to that task analysis: for each bottom-level operation, enumerate the credible error modes, their consequences, recovery and criticality. Present it as the standard tabular output.
- Administer NASA-TLX to yourself on two tasks of visibly different demand, following the full weighting procedure rather than the raw shortcut, and write half a page on whether the numbers matched your experience.
- Use the Salvendy Handbook the way it is meant to be used: pick a real design problem, identify the two or three chapters that bear on it, and write a two-page technical memo citing them. If you cannot identify the right chapters, that is the signal that a prior stage is incomplete.
Next up: This closes the path: you can see the mismatch, model it, measure it on real bodies and real cognition, and select the method that gives a defensible answer.

Wickens's advanced companion: signal detection, multiple resource theory, decision making and mental workload treated quantitatively. This is where display and automation design stops being heuristic.

A practitioner's catalogue of the methods themselves — hierarchical task analysis, SHERPA, NASA-TLX, situation awareness measures — with worked procedures. Read once you know what you are trying to measure.

The field's reference volume, to be consulted rather than read through. It closes the path because it is only useful once you can tell which of its several dozen specialist chapters you need.
Discussion
Keep reading
Paths that share books, cover the same subject, or open a related topic.