The Best Books to Learn Algorithmic Trading, in Order
This curriculum is designed for expert-level practitioners who already understand finance and programming, and want to master algorithmic trading end-to-end—from rigorous strategy design and quantitative research to production-grade automated systems. The four stages move from quantitative strategy foundations, through statistical and ML-driven edge discovery, into robust backtesting and risk frameworks, and finally to the engineering of live trading infrastructure.
Quantitative Strategy Foundations
ExpertEstablish a rigorous, practitioner-grade mental model of how quantitative strategies are conceived, classified, and evaluated—building the shared vocabulary needed for everything that follows.
▸ Study plan for this stage
Pace: 4–5 weeks, ~40–50 pages/day with daily reflection and weekly problem sets
- The distinction between mean reversion, momentum, and other core strategy archetypes and when each is applicable
- How to construct a proper backtest: data handling, survivorship bias, look-ahead bias, and transaction costs
- The relationship between Sharpe ratio, maximum drawdown, and other key performance metrics in evaluating strategy quality
- The role of correlation, cointegration, and pair trading as foundational quantitative techniques
- How to identify and quantify edge: statistical significance testing and the dangers of overfitting
- Position sizing, leverage, and risk management as integral to strategy design—not afterthoughts
- The mechanics of implementation: market microstructure, execution slippage, and real-world constraints
- Building a mental model of strategy lifecycle: conception, validation, deployment, and degradation
- What are the key differences between mean reversion and momentum strategies, and what market conditions favor each?
- How do survivorship bias and look-ahead bias corrupt backtests, and what specific steps does Chan recommend to avoid them?
- Explain the relationship between Sharpe ratio and maximum drawdown. Why is Sharpe ratio alone insufficient for strategy evaluation?
- What is cointegration, how does it differ from correlation, and why is it critical for pair trading?
- How do you distinguish between genuine edge and overfitting? What statistical tests should you apply?
- Why must position sizing and leverage be determined by risk management principles rather than profit maximization?
- Backtest a simple mean reversion strategy on a single stock using 5 years of daily data; deliberately introduce survivorship bias in one version and compare results
- Construct a cointegrated pair from two correlated assets; verify the cointegration relationship using the Augmented Dickey-Fuller test and document the results
- Calculate Sharpe ratio, maximum drawdown, and Calmar ratio for a given strategy's equity curve; interpret what each metric reveals about risk-adjusted returns
- Design a position sizing scheme for a strategy with known edge; justify your choices using Kelly criterion or similar frameworks
- Implement a basic pair trading strategy with explicit transaction costs and slippage assumptions; compare theoretical P&L to realistic P&L
- Write a one-page strategy memo that describes a potential quantitative strategy, its edge, expected Sharpe ratio, and key risks—then identify potential overfitting traps
Next up: Mastering these foundations—strategy archetypes, rigorous backtesting, and risk-aware evaluation—equips you to move into implementation details: how to source and clean market data, build production-grade systems, and navigate the practical challenges of live trading.
A concise, code-driven entry point for experts that covers mean-reversion, momentum, and statistical arbitrage with real examples. Sets the practical vocabulary and strategy taxonomy used throughout the field.
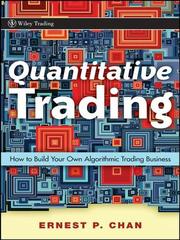
Complements the first Chan book by focusing on the business and research process—data sourcing, strategy selection, and position sizing—giving a complete picture of the quant workflow before diving deeper.
Statistical Edge & Quantitative Methods
ExpertMaster the statistical and mathematical tools—time-series analysis, factor models, cointegration, and machine learning—used to find and validate genuine edges in market data.
▸ Study plan for this stage
Pace: 12–14 weeks, ~40–50 pages/day with 2–3 days/week for implementation and backtesting
- Labeling and feature engineering for financial time series (triple-barrier method, fractional differentiation)
- Meta-labeling and stacking to improve signal quality and reduce false positives
- Factor models (linear regression, PCA, Fama-French) to isolate alpha from systematic risk
- Cointegration and mean reversion strategies to identify stationary trading pairs
- Walk-forward validation and cross-validation techniques that avoid look-ahead bias in backtesting
- Machine learning pipelines (ensemble methods, hyperparameter tuning) for market prediction
- Microstructure effects, market impact, and optimal execution algorithms in high-frequency contexts
- Risk management and position sizing under realistic transaction costs and slippage
- What is the triple-barrier method and how does it improve label quality compared to fixed-horizon returns?
- How does fractional differentiation preserve memory in time series while making it stationary?
- What is meta-labeling and why does it reduce false positives in machine learning trading signals?
- How do you use cointegration tests to identify mean-reversion opportunities between asset pairs?
- Why is walk-forward validation superior to standard cross-validation for backtesting trading strategies?
- What are the main microstructure costs (market impact, adverse selection, inventory risk) and how do they affect strategy profitability?
- Implement the triple-barrier labeling method on 1–2 years of OHLCV data for a liquid stock; compare label distributions to fixed-return labels
- Apply fractional differentiation to a price series at different d values (0.3–0.7); verify stationarity with ADF tests and plot autocorrelation decay
- Build a simple linear factor model (e.g., Fama-French 3-factor) on daily returns; decompose a strategy's returns into alpha and beta components
- Conduct a cointegration analysis on 2–3 correlated asset pairs; design and backtest a mean-reversion strategy on the spread using walk-forward validation
- Implement a meta-labeling pipeline: train a primary classifier, then a secondary meta-learner on the primary's predictions; measure precision/recall improvement
- Backtest a machine learning strategy (e.g., random forest or gradient boosting) with realistic transaction costs, slippage, and position sizing; compare in-sample vs. out-of-sample performance
Next up: This stage equips you with the statistical rigor and quantitative tools to validate genuine market edges; the next stage will focus on deploying these edges in live trading systems, managing operational risk, and scaling strategies across asset classes and market regimes.

The definitive modern text on applying ML correctly to financial data, covering bar sampling, feature engineering, cross-validation pitfalls, and bet sizing. Must be read before any ML-based strategy work.

A tighter, more theoretical companion that covers clustering, portfolio construction, and entropy-based methods—deepens the statistical intuition built in the previous book.

Provides the rigorous stochastic-control and market-microstructure mathematics underlying HFT and optimal execution strategies—essential for understanding edge at the microstructure level.
Backtesting, Risk & Portfolio Construction
ExpertLearn to design statistically sound backtests, avoid overfitting and look-ahead bias, and build robust risk and portfolio frameworks that hold up out-of-sample.
▸ Study plan for this stage
Pace: 12–14 weeks, ~40–50 pages/day. Allocate 4–5 weeks per book with overlap: Aronson (foundational rigor), Grinold (portfolio optimization), Carver (systems integration). Plan 2–3 review/synthesis weeks at the end.
- Statistical hypothesis testing and the multiple comparisons problem in backtesting (Aronson's framework for avoiding false discoveries)
- Overfitting detection: out-of-sample testing, walk-forward analysis, and parameter stability (Aronson, Carver)
- Look-ahead bias, survivorship bias, and other backtest pitfalls that invalidate results (Aronson)
- The Fundamental Law of Active Management and information ratio as the core metric (Grinold)
- Portfolio construction: optimal position sizing, leverage, and diversification using mean-variance optimization (Grinold, Carver)
- Risk budgeting and volatility targeting to align portfolio risk with strategy constraints (Carver)
- Drawdown analysis, maximum adverse excursion (MAE), and tail-risk metrics beyond Sharpe ratio (Aronson, Carver)
- Translating strategy logic into systematic rules and monitoring live performance degradation (Carver)
- What is the multiple comparisons problem in backtesting, and how does Aronson's approach (e.g., Bonferroni correction, permutation testing) help you avoid false discoveries?
- Describe the difference between in-sample and out-of-sample testing, and explain why walk-forward analysis is superior to a single train-test split.
- How can you detect and quantify look-ahead bias in a backtest? Give at least two concrete examples from your own strategy.
- What is the Fundamental Law of Active Management, and how does it relate to the information ratio as the primary performance metric?
- Explain how to construct a portfolio using mean-variance optimization. What are the key inputs, and what are the practical limitations Grinold and Carver discuss?
- How does risk budgeting differ from position sizing, and why is volatility targeting essential for robust portfolio construction?
- What metrics beyond Sharpe ratio should you monitor (e.g., maximum drawdown, Calmar ratio, tail risk), and when is each most relevant?
- How do you transition from a backtest to live trading while monitoring for strategy degradation and regime change?
- Implement a backtest of a simple mean-reversion or trend-following strategy. Deliberately introduce look-ahead bias (e.g., using future prices to set stops), then remove it and compare results. Document the difference.
- Run a parameter sweep on your strategy (e.g., 50 different MA periods). Calculate the number of false discoveries expected by chance alone using Aronson's multiple comparisons framework. Compare to your actual results.
- Conduct a walk-forward analysis: divide your data into 5–10 periods, optimize on the first period, test on the second (out-of-sample), then roll forward. Plot in-sample vs. out-of-sample performance and comment on degradation.
- Calculate the information ratio for your strategy using Grinold's formula (excess return / tracking error). Decompose it into skill (IC) and breadth (N) to understand where edge comes from.
- Build a mean-variance efficient frontier for 3–5 assets or strategies. Compute the optimal portfolio weights and compare to equal-weight and risk-parity allocations. Discuss practical constraints.
- Implement volatility targeting: scale your positions so the portfolio maintains a constant target volatility (e.g., 10% annualized). Backtest and compare to fixed-position sizing.
- Analyze the maximum drawdown and Calmar ratio of your strategy. Identify the worst consecutive losing period and explain whether it was due to regime change or overfitting.
- Write a backtest report (2–3 pages) that documents: the hypothesis, data sources, look-ahead bias checks, parameter sensitivity, out-of-sample results, and risk metrics. Identify one key risk you would monitor live.
Next up: This stage equips you with the statistical rigor and portfolio discipline to build strategies that survive out-of-sample, setting the foundation for the next stage—implementation and live trading—where you'll apply these frameworks to real markets, manage slippage and costs, and adapt to regime shifts.
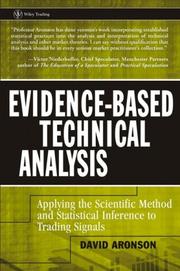
Provides a rigorous statistical framework for testing trading rules and guarding against data-snooping bias—foundational for any serious backtesting methodology.

The canonical text on the Fundamental Law of Active Management, alpha forecasting, and risk-adjusted portfolio construction—gives the theoretical backbone for translating signals into positions.
Bridges theory and practice with a concrete, rules-based framework for position sizing, diversification, and combining multiple strategies—ideal after Grinold to operationalize portfolio construction.
Building Production Automated Trading Systems
ExpertDesign and deploy robust, production-grade automated trading systems—covering execution algorithms, infrastructure, latency, and operational risk management.
▸ Study plan for this stage
Pace: 8–10 weeks, ~40–50 pages/day (mix of dense technical chapters and practical application work)
- Quantitative model architecture: signal generation, portfolio construction, and risk management layers in systematic trading systems
- Execution algorithms and market microstructure: how order routing, fill optimization, and latency impact real-world performance
- Infrastructure requirements for production systems: data pipelines, backtesting frameworks, live monitoring, and failsafes
- Market structure and trading venues: order types, market makers, liquidity provision, and how exchange design affects strategy profitability
- Operational and execution risk: slippage, adverse selection, market impact, and techniques to measure and mitigate them
- Latency and technology stack: hardware, networking, and algorithmic optimization for sub-millisecond execution
- Regulatory and compliance constraints: position limits, reporting, and how rules shape system design
- From backtesting to live deployment: bridging the gap between historical performance and production reality
- What are the core functional layers of a production quantitative trading system, and how do signal generation, portfolio optimization, and risk management interact?
- How do different execution algorithms (VWAP, TWAP, implementation shortfall) work, and when should each be deployed based on market conditions and order characteristics?
- What is market microstructure, and how do order types, bid-ask spreads, and market maker behavior directly impact the profitability and feasibility of automated strategies?
- What are the primary sources of execution risk (slippage, market impact, adverse selection), and what quantitative methods can measure and reduce them?
- How should a production trading system be architected to handle latency, data integrity, and operational failures while maintaining compliance?
- What is the relationship between backtesting assumptions and live performance, and what steps bridge this gap?
- Design a three-layer trading system architecture (signal, portfolio, execution) on paper or in pseudocode, specifying data inputs, decision logic, and risk controls for a specific strategy type
- Implement a simple execution algorithm simulator (VWAP or TWAP) that processes historical tick data and measures realized slippage against a benchmark
- Conduct a market microstructure analysis: collect order book snapshots from a real exchange (or use public datasets), calculate bid-ask spreads, depth, and adverse selection costs for a given security
- Build a latency profiling tool that measures end-to-end latency (data ingestion → signal → order submission) in a simulated trading environment
- Create a production readiness checklist for deploying a live trading system, covering data validation, failsafes, monitoring, compliance, and rollback procedures
- Perform a backtesting-to-live reconciliation: run a strategy backtest, then compare assumptions (fill prices, slippage, market impact) against actual live fills to quantify the gap
Next up: This stage equips you with the engineering and operational foundations to build systems that survive real markets; the next stage will likely focus on advanced strategy research, machine learning integration, or multi-asset portfolio management—all of which depend on having a robust, trustworthy execution backbone.

Demystifies the architecture of real quant hedge fund systems—alpha models, risk models, execution, and data—providing the systems-design blueprint before writing production code.
The authoritative deep-dive into market microstructure, order types, and exchange mechanics—critical knowledge for designing smart order routing and execution algorithms in live systems.
Discussion
Keep reading
Paths that share books, cover the same subject, or open a related topic.