Learn pandas: The Best Books for Data Analysis in Python
This curriculum takes a beginner from Python and pandas basics all the way through advanced data wrangling, cleaning, and visualization — building intuition before technique at every stage. Each stage introduces the vocabulary and mental models needed for the next, so no step feels like a leap.
Python Foundations
BeginnerBuild enough core Python fluency — data types, loops, functions, and libraries — so that pandas syntax feels natural rather than foreign.
▸ Study plan for this stage
Pace: 6–8 weeks, ~40–50 pages/day (Python Crash Course: Chapters 1–10, ~3–4 weeks; Python for Data Analysis: Chapters 1–4, ~3–4 weeks)
- Python data types (strings, lists, tuples, dictionaries, sets) and when to use each
- Control flow: conditionals (if/elif/else) and loops (for, while) for iterating over data structures
- Functions: defining, parameters, return values, and scope—essential for writing reusable code
- Working with libraries (import statements, namespacing) and understanding how pandas fits into the Python ecosystem
- NumPy arrays and vectorized operations as the foundation for pandas Series and DataFrames
- File I/O and reading data from disk, a prerequisite for loading data into pandas
- Debugging and error handling (try/except) to troubleshoot issues in data workflows
- What are the key differences between lists, tuples, and dictionaries, and when would you use each in a data workflow?
- How do for loops and list comprehensions work, and why is iteration central to data processing?
- How do you define a function, and what is the relationship between parameters, arguments, and return values?
- What is the purpose of NumPy arrays, and how do they differ from Python lists in terms of performance and functionality?
- How do you import a library (like NumPy or pandas) and access its functions using dot notation?
- How do you read data from a CSV or other file format into Python, and what does the data look like once loaded?
- From Python Crash Course: Complete the 'Try It Yourself' exercises at the end of Chapters 3–5 (data types and control flow), building small programs that manipulate lists and dictionaries
- Write a function that takes a list of numbers and returns the sum, average, and count—practice parameter passing and return values
- Create a program that reads a CSV file (e.g., a simple dataset of names and ages), stores it in a list of dictionaries, and filters/prints records based on a condition
- From Python for Data Analysis, Chapter 2: Work through the NumPy examples, creating arrays, performing element-wise operations, and reshaping data
- Build a small data pipeline: read a text file, parse lines into structured data (lists/dicts), apply transformations using loops or list comprehensions, and write results to a new file
- Write 3–4 functions that perform common data operations (e.g., filtering, counting, sorting) on a list of dictionaries, then combine them into a single script
Next up: Mastering Python's core data structures, control flow, and function design—plus familiarity with NumPy arrays—equips you to understand pandas DataFrames as a natural extension of these concepts, making the syntax and idioms of data manipulation feel intuitive rather than overwhelming.

The clearest, most practical intro to Python for beginners; covers lists, dictionaries, and functions — the exact building blocks pandas is built on. Reading this first prevents confusion between Python itself and pandas-specific behavior.
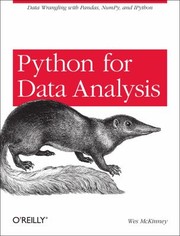
Written by the creator of pandas, this is the canonical reference for NumPy and pandas fundamentals. It belongs at the end of the foundations stage because it assumes basic Python comfort but starts pandas from scratch.
Core pandas — DataFrames & Data Cleaning
BeginnerConfidently create, inspect, filter, reshape, and clean DataFrames; handle missing data, duplicates, and type conversions on real datasets.
▸ Study plan for this stage
Pace: 4–5 weeks, ~40–50 pages/day (alternating between Pandas in Action and Learning pandas, with 2–3 days per week dedicated to hands-on exercises)
- DataFrame creation from multiple sources (lists, dicts, CSV, databases) and understanding the index/columns structure
- Data inspection techniques: head(), tail(), info(), describe(), dtypes, and shape to understand your data at a glance
- Boolean indexing and .loc/.iloc for precise row and column filtering and selection
- Handling missing data: identifying NaN values, imputation strategies, and dropna() vs fillna() trade-offs
- Detecting and removing duplicates: drop_duplicates(), identifying duplicate rows, and understanding when to keep/remove them
- Type conversion and data cleaning: astype(), converting strings to datetime, categorical data, and handling inconsistent formats
- Reshaping DataFrames: melt(), pivot(), stack/unstack, and concatenation/merging for combining multiple datasets
- Practical data cleaning workflows: chaining operations, validating cleaned data, and documenting transformations
- How do you create a DataFrame from a CSV file, and what are the key methods to inspect its structure and contents?
- What is the difference between .loc and .iloc, and when would you use each for filtering rows and columns?
- How do you identify, handle, and decide whether to drop or impute missing values in a dataset?
- What strategies can you use to detect and remove duplicate rows, and how do you handle cases where duplicates might be intentional?
- How do you convert data types (e.g., string to datetime, object to category) and clean inconsistent formatting in a column?
- How do you reshape a DataFrame using melt(), pivot(), or concatenation, and what real-world scenarios require each approach?
- Load a real-world CSV dataset (e.g., from Kaggle or UCI ML Repository) and use head(), info(), describe(), and dtypes to create a data inspection checklist
- Practice boolean indexing: filter a DataFrame by multiple conditions (e.g., rows where age > 30 AND salary < 100000) using both bracket notation and .loc
- Identify and remove duplicates from a messy dataset; document which rows were duplicates and justify your removal strategy
- Take a dataset with missing values and implement three different strategies (drop, forward-fill, mean imputation); compare results and explain trade-offs
- Convert mixed-format date strings (e.g., '01/15/2023', '2023-01-15', 'Jan 15, 2023') to a consistent datetime column using pd.to_datetime()
- Reshape a wide-format dataset to long format using melt(), then pivot it back; verify the transformation preserves all data
- Merge or concatenate two related datasets (e.g., customer info + purchase history) and clean up any resulting duplicates or mismatches
- Build a complete data cleaning pipeline on a real dataset: load → inspect → handle missing data → remove duplicates → convert types → reshape → validate and document
Next up: Mastering DataFrame fundamentals and data cleaning prepares you to move into exploratory data analysis (EDA), where you'll use these cleaned datasets to uncover patterns, relationships, and insights through grouping, aggregation, and visualization.

A hands-on, example-driven guide that walks through every major DataFrame operation step by step — ideal right after McKinney because it reinforces concepts with richer narrative and exercises.

Focuses specifically on practical data-cleaning workflows — indexing, merging, grouping — filling in the 'how do I actually fix messy data?' gap before moving to wrangling at scale.
Data Wrangling & Transformation
IntermediateMaster advanced reshaping (pivot, melt, stack/unstack), merging strategies, time-series handling, and applying custom functions across large datasets efficiently.
▸ Study plan for this stage
Pace: 4–5 weeks, ~40–50 pages/day (with practice notebooks interspersed)
- Reshaping operations (pivot, melt, stack/unstack) to transform data from wide to long format and vice versa
- Merging, joining, and concatenating DataFrames using different join strategies (inner, outer, left, right) and handling key mismatches
- Time-series data handling: parsing dates, setting datetime indices, resampling, and rolling window operations
- Applying custom functions efficiently across DataFrames using apply(), applymap(), and groupby().transform()
- Data cleaning pipelines: handling missing values, duplicates, and type conversions at scale
- Performance optimization: vectorization, chunking large datasets, and avoiding common pandas pitfalls
- Combining multiple transformation techniques into reproducible, maintainable data wrangling workflows
- When should you use pivot() vs. melt(), and how do you handle duplicate entries during pivoting?
- What are the differences between merge(), join(), and concat(), and when is each appropriate for combining DataFrames?
- How do you parse and handle time-series data in pandas, and what is the difference between resampling and rolling windows?
- How can you apply custom functions efficiently across large DataFrames, and what are the performance trade-offs between apply(), applymap(), and vectorized operations?
- What strategies should you use to handle missing values and duplicates in large datasets, and how do you validate data quality after wrangling?
- How do you chain multiple wrangling operations into a reproducible pipeline, and what are best practices for debugging complex transformations?
- Load a messy real-world dataset (e.g., from Kaggle) and perform a complete pivot/melt workflow: convert wide data to long format, clean it, then pivot back to answer a specific question.
- Practice merging three or more DataFrames using different join types (inner, outer, left, right) on mismatched keys; document which rows are lost in each join and why.
- Create a time-series analysis: parse date columns, set datetime index, resample data at different frequencies (daily → weekly → monthly), and calculate rolling averages.
- Write custom functions (lambda and named functions) and apply them across a DataFrame using apply(), applymap(), and groupby().transform(); compare execution times and memory usage.
- Build a data wrangling pipeline that takes raw input data through 5+ transformation steps (cleaning, reshaping, merging, time-series handling, aggregation) and produces a clean output; document each step.
- Identify and fix performance bottlenecks in a slow wrangling script: replace loops with vectorized operations, use chunking for large files, and profile memory usage with memory_profiler.
Next up: This stage equips you with the foundational data transformation skills needed to move into exploratory data analysis and statistical modeling, where clean, well-structured data is essential for drawing reliable insights.

Bridges the gap between cleaning and transformation by tackling real-world messy data sources; introduces the wrangling mindset needed before tackling performance-oriented techniques.
Visualization & Exploratory Analysis
IntermediateProduce insightful visualizations directly from pandas and with Matplotlib/Seaborn; conduct structured exploratory data analysis (EDA) to extract and communicate findings.
▸ Study plan for this stage
Pace: 6–8 weeks, ~40–50 pages/day (mix of dense technical content and narrative-driven chapters)
- Matplotlib fundamentals: figures, axes, and the object-oriented interface for precise plot control
- Pandas integration with Matplotlib: plotting directly from Series and DataFrames using .plot()
- Seaborn for statistical visualization: distributions, relationships, and categorical data with minimal code
- Color theory, visual hierarchy, and design principles for effective data communication
- Exploratory Data Analysis (EDA) workflow: univariate, bivariate, and multivariate analysis patterns
- Identifying and communicating key insights: choosing appropriate chart types to match your message
- Pre-attentive processing and cognitive load: designing visualizations that viewers understand instantly
- Avoiding misleading visualizations: ethical considerations in axis scaling, color choice, and data representation
- How do you create and customize a multi-panel figure in Matplotlib using the object-oriented interface, and when is this preferable to pyplot?
- What is the difference between a Matplotlib figure and axes, and how do you control them independently?
- How would you use pandas .plot() and Seaborn to quickly explore the distribution of a numeric column and the relationship between two variables?
- What chart types are most effective for different data scenarios (e.g., distributions, comparisons, relationships, composition), and why?
- How do you design a visualization to minimize cognitive load and leverage pre-attentive processing?
- What are common ways visualizations can mislead viewers, and how do you avoid them?
- How would you structure an EDA to systematically uncover patterns in a new dataset before formal modeling?
- Create a multi-panel Matplotlib figure with 4+ subplots exploring different aspects of a dataset (distributions, scatter plots, time series)
- Load a real dataset (e.g., Titanic, Iris, or a CSV of your choice) and use pandas .plot() to generate 5–6 exploratory plots in under 10 lines of code
- Use Seaborn to create a pairplot and heatmap for a dataset; interpret the relationships revealed
- Redesign a poorly designed chart (find one online or create one intentionally) following Knaflic's principles: remove clutter, add context, choose an appropriate chart type
- Conduct a full EDA on a dataset: univariate analysis (distributions, outliers), bivariate analysis (correlations, groupwise comparisons), and document 3–5 key findings with supporting visualizations
- Create a narrative visualization: a sequence of 3–4 related charts that tell a story about a dataset, with titles and annotations guiding the viewer's attention
- Experiment with color palettes, axis limits, and annotations in Matplotlib to make the same data tell different stories; reflect on which version is most honest and clear
Next up: This stage equips you with both the technical skills to generate publication-quality visualizations and the design intuition to communicate findings persuasively, preparing you to move into statistical modeling and inference where visualization becomes essential for validating assumptions and interpreting results.

Covers pandas, Matplotlib, and Seaborn together in one cohesive resource, showing how visualization and data manipulation interlock — perfect at this stage because you already know pandas and can focus on the visual storytelling layer.
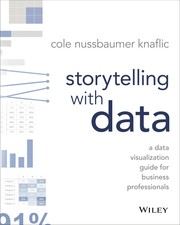
Shifts focus from 'how to plot' to 'how to communicate with data' — a crucial mindset upgrade that makes your visualizations genuinely useful rather than just technically correct.
Advanced Mastery & Real-World Practice
ExpertApply pandas fluently to end-to-end analytical projects, optimize for performance on large datasets, and integrate pandas into broader data science pipelines.
▸ Study plan for this stage
Pace: 4–5 weeks, ~40–50 pages/day, with 2–3 days per week dedicated to hands-on projects
- PySpark fundamentals: RDDs, DataFrames, and the Catalyst optimizer for distributed computing
- Pandas-to-PySpark migration patterns: translating familiar pandas operations to Spark equivalents
- Handling large-scale datasets: partitioning strategies, memory management, and avoiding common performance pitfalls
- Data pipeline architecture: designing ETL workflows that combine pandas for small-scale preprocessing with PySpark for distributed processing
- SQL integration in Spark: writing efficient SQL queries and leveraging Spark SQL for complex analytical operations
- Performance tuning and optimization: caching, broadcasting, and query plan analysis in Spark
- Real-world integration: connecting Spark to external data sources (HDFS, S3, databases) and orchestrating multi-stage analytical workflows
- How do you decide whether to use pandas, PySpark, or a hybrid approach for a given analytical task, and what are the performance trade-offs?
- Explain the role of the Catalyst optimizer in PySpark and how it differs from pandas' execution model.
- How would you refactor a pandas-based data pipeline to run on PySpark while maintaining correctness and improving scalability?
- What are the key partitioning and caching strategies you'd use to optimize a PySpark job processing terabytes of data?
- How do you debug and profile a slow PySpark query, and what tools would you use to identify bottlenecks?
- Describe an end-to-end analytical workflow: from raw data ingestion through transformation, aggregation, and output, using both pandas and PySpark where appropriate.
- Migrate a multi-step pandas analysis (groupby, merge, filtering, aggregation) to PySpark and benchmark performance on datasets of increasing size (1GB, 10GB, 100GB+).
- Build a hybrid ETL pipeline: use pandas for data validation and cleaning on a sample, then scale the transformation logic to PySpark for the full dataset.
- Write and optimize a complex PySpark SQL query (with joins, window functions, and subqueries) and analyze the Catalyst execution plan using explain().
- Implement a distributed data pipeline that reads from multiple sources (CSV, Parquet, SQL database), applies transformations, and writes results to a data warehouse.
- Profile a slow PySpark job using Spark UI and driver logs; identify the bottleneck (shuffle, memory, I/O) and apply targeted optimizations (repartitioning, caching, broadcast joins).
- Create a production-ready analytical workflow: implement error handling, logging, data validation, and idempotency for a multi-stage Spark job processing real-world data.
Next up: This stage equips you to architect and execute large-scale analytical systems that seamlessly integrate pandas for agile exploration with PySpark for production-grade distributed processing, preparing you for specialized topics like machine learning pipelines, streaming analytics, or cloud-native data engineering.

Introduces the transition from single-machine pandas to distributed data processing, giving advanced learners a clear picture of where pandas fits in large-scale production pipelines and when to reach for other tools.
Discussion
Keep reading
Paths that share books, cover the same subject, or open a related topic.