Best Books to Become a Data Scientist (in Order)
This curriculum takes an intermediate learner from solid statistical thinking through Python fluency, into applied machine learning, and finally into the professional craft of showcasing work and landing a data science role. Each stage builds the vocabulary and tools needed for the next, so no step feels like a leap.
Statistical Foundations
IntermediateDevelop rigorous statistical intuition — probability, inference, and thinking with data — so that every ML algorithm encountered later has a principled foundation.
▸ Study plan for this stage
Pace: 8–10 weeks, ~40–50 pages/day. Start with "Naked Statistics" (2–3 weeks, lighter pace to build intuition), move to "Statistics" (3–4 weeks, slower for depth), finish with "Practical Statistics" (2–3 weeks, applied focus).
- Probability as the language of uncertainty: understanding distributions, conditional probability, and Bayes' theorem from Wheelan and Freedman
- Sampling and sampling distributions: why samples vary, the Central Limit Theorem, and how it enables inference (Freedman's core theme)
- Hypothesis testing and p-values: what they mean, what they don't mean, and common pitfalls (Wheelan's skepticism + Freedman's rigor + Bruce's practical warnings)
- Confidence intervals and estimation: constructing and interpreting intervals that quantify uncertainty in parameters
- Correlation vs. causation: recognizing confounding, Simpson's paradox, and the limits of observational data (Wheelan's critical lens)
- Regression as a tool for prediction and inference: fitting lines, interpreting coefficients, and understanding residuals (Freedman's foundation + Bruce's applied perspective)
- Experimental design and randomization: why randomized experiments trump observational studies for causal claims (Freedman's emphasis)
- Multiple testing and p-hacking: how to avoid fooling yourself with data (Bruce's practical focus on real-world pitfalls)
- Explain why the Central Limit Theorem matters for statistical inference and give a concrete example of how it applies to a real dataset.
- What is the difference between a p-value and a confidence interval? When would you use one over the other?
- You observe a strong correlation between two variables in your data. What are three alternative explanations besides direct causation, and how would you investigate them?
- Describe the logic of hypothesis testing: what is a null hypothesis, what does rejecting it mean, and what are two ways you can make a mistake?
- Why is randomization in experiments so powerful compared to observational studies? Give an example of a confounding variable that randomization would eliminate.
- What does it mean for a confidence interval to have 95% coverage? Why is this not the same as saying 'the parameter has a 95% probability of being in this interval'?
- You fit a linear regression model and get a high R² but the residuals show a clear pattern. What does this tell you, and what might you do next?
- Explain Simpson's paradox with a concrete example. Why does it matter for data scientists making business decisions?
- Complete Wheelan's thought experiments (e.g., the Texas sharpshooter problem, the birthday paradox) by hand; then simulate them in Python to verify intuition.
- Using a dataset of your choice (e.g., Kaggle, UCI ML repo), compute sample means from 100 random samples of size n=30, then plot the distribution and verify it approximates a normal distribution (Central Limit Theorem in action).
- Conduct a hypothesis test on a real dataset: formulate a null hypothesis, calculate a test statistic, find the p-value, and write a one-paragraph interpretation of what you can and cannot conclude.
- Build a simple linear regression model (e.g., predicting house prices from square footage); interpret the slope coefficient, compute a 95% confidence interval for it, and explain what that interval means.
- Find a published study claiming causation from observational data; identify at least three potential confounding variables and explain how each could explain the observed association.
- Simulate p-hacking: generate random data with no true effect, then repeatedly test different hypotheses until you find a 'significant' result (p < 0.05). Reflect on why this is misleading.
- Analyze a dataset for Simpson's paradox: stratify by a third variable and show how the direction of association can reverse. Write up the business implication.
- Design a simple A/B test for a hypothetical product decision: state the null hypothesis, choose a sample size, specify the decision rule, and explain why randomization matters.
Next up: This stage equips you with the statistical reasoning and skepticism needed to understand how machine learning algorithms work: every model makes assumptions about data, estimates parameters from samples, and trades bias for variance—all concepts rooted in the probability and inference you've now internalized.
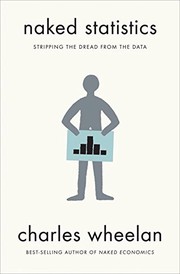
A fast, engaging refresher that rebuilds statistical intuition without heavy math — clears up misconceptions before diving into technical material.
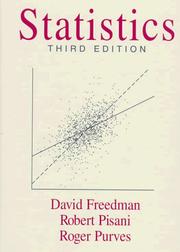
A rigorous but accessible deep-dive into inference, regression, and probability that gives the conceptual backbone every data scientist needs before touching models.

Bridges pure statistics and data science practice, covering resampling, distributions, and regression with real code examples — the perfect handoff into Python.
Python for Data Science
IntermediateBecome fluent in the Python data stack (NumPy, pandas, Matplotlib, Seaborn) and develop the coding habits needed to manipulate, explore, and visualize real datasets confidently.
▸ Study plan for this stage
Pace: 8–10 weeks, ~40–50 pages/day with 2–3 days/week for hands-on coding practice
- NumPy fundamentals: ndarray creation, indexing, slicing, broadcasting, and vectorized operations for efficient numerical computing
- pandas DataFrames and Series: data structures, indexing, selection, alignment, and hierarchical indexing for tabular data manipulation
- Data cleaning and transformation: handling missing values, data type conversion, merging/joining datasets, and reshaping with pivot tables and melting
- Exploratory Data Analysis (EDA): descriptive statistics, groupby operations, and aggregation to understand data patterns and distributions
- Matplotlib and Seaborn visualization: creating publication-quality plots (line, scatter, histogram, box, heatmap) and customizing aesthetics for storytelling
- Time series data: parsing dates, resampling, rolling windows, and working with temporal indices in pandas
- Performance and best practices: writing efficient, readable code; avoiding common pitfalls; and developing habits for reproducible data workflows
- How do NumPy broadcasting rules work, and why do they enable efficient vectorized operations without explicit loops?
- What are the key differences between .loc, .iloc, and boolean indexing in pandas, and when should you use each?
- How do you handle missing data in pandas (NaN, None), and what are the trade-offs between dropping, forward-filling, and interpolating?
- Explain the difference between merge, join, and concat operations in pandas, and when each is appropriate for combining datasets.
- How do you use groupby() for aggregation and transformation, and what is the difference between agg() and transform()?
- What are the main plot types in Matplotlib and Seaborn, and how do you choose between them for different data distributions and relationships?
- How do you work with time series data in pandas (DatetimeIndex, resampling, rolling windows), and why is proper date parsing critical?
- Load a real CSV dataset (e.g., Titanic, housing, or weather data) and perform end-to-end EDA: inspect shape/dtypes, check for missing values, compute summary statistics, and identify outliers.
- Create a NumPy array from scratch, practice slicing, indexing, and broadcasting with at least 3 different operations; verify results match expected shapes.
- Clean a messy dataset: handle missing values using multiple strategies (drop, fill, interpolate), convert data types, rename columns, and document your choices.
- Merge two related datasets using different join types (inner, outer, left, right) and explain how the results differ; visualize the impact with a before/after comparison.
- Perform a multi-level groupby aggregation (e.g., group by category and date, calculate mean and count) and reshape the result using pivot_table or unstack.
- Create a figure with 4+ subplots using Matplotlib: line plot, histogram, scatter plot, and box plot on the same dataset; customize colors, labels, and legends.
- Build a Seaborn visualization dashboard (3–4 plots) exploring relationships between variables: use heatmap for correlations, pairplot for distributions, and catplot for categorical comparisons.
- Work with a time series dataset: parse dates, set DatetimeIndex, resample to different frequencies, calculate rolling averages, and plot trends over time.
Next up: This stage equips you with the technical fluency to wrangle, explore, and visualize real data—the essential foundation for the next stage, which will focus on statistical modeling, machine learning algorithms, and applying these tools to predictive problems.
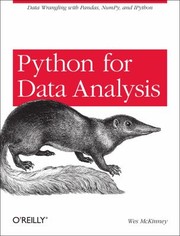
Written by the creator of pandas, this is the definitive reference for data wrangling in Python — essential reading before any serious ML work.

Covers the full scientific Python ecosystem end-to-end, including a strong introduction to scikit-learn that sets up the machine learning stage perfectly.
Machine Learning — Theory & Practice
IntermediateUnderstand how core ML algorithms work mathematically and how to apply, tune, and evaluate them responsibly on real-world data.
▸ Study plan for this stage
Pace: 12–14 weeks, ~40–50 pages/day (mix of dense theory and hands-on coding). Allocate 6–7 weeks to Géron (Chapters 1–10), 4–5 weeks to James (Chapters 1–8), and 1–2 weeks to Knaflic.
- Supervised learning fundamentals: regression and classification with linear models, decision trees, and ensemble methods (bagging, boosting, random forests)
- Unsupervised learning: clustering (K-means, hierarchical) and dimensionality reduction (PCA) to discover patterns in unlabeled data
- The bias-variance tradeoff and regularization techniques (L1/L2, dropout) to prevent overfitting and improve generalization
- Model evaluation and validation: train/test splits, cross-validation, performance metrics (accuracy, precision, recall, F1, AUC-ROC, MSE/RMSE), and hyperparameter tuning
- Statistical foundations: probability distributions, hypothesis testing, confidence intervals, and maximum likelihood estimation underlying ML algorithms
- Neural networks and deep learning basics: perceptrons, backpropagation, activation functions, and when to use deep learning vs. simpler models
- Data preprocessing and feature engineering: handling missing values, scaling, encoding, and creating meaningful features for model input
- Communicating results responsibly: visualizing model performance, interpreting predictions, acknowledging limitations, and avoiding misleading conclusions
- Explain the bias-variance tradeoff and describe how regularization (L1/L2 penalties, early stopping) helps manage it in practice.
- Compare and contrast supervised learning (regression/classification) with unsupervised learning (clustering/PCA); when would you use each?
- Walk through the steps of building, evaluating, and tuning a machine learning model on a real dataset: what metrics matter for your problem, and how do you avoid overfitting?
- Describe how ensemble methods (random forests, gradient boosting) reduce variance and improve prediction accuracy compared to single models.
- What is backpropagation, and why is it fundamental to training neural networks? When is deep learning preferable to simpler algorithms?
- How do you responsibly communicate model results to non-technical stakeholders? What pitfalls should you avoid when visualizing and interpreting predictions?
- Build a linear regression model on a real dataset (e.g., housing prices from Géron's examples), evaluate it with train/test split and cross-validation, and experiment with regularization (Ridge/Lasso) to reduce overfitting.
- Implement a classification pipeline using logistic regression and a decision tree on a binary classification problem (e.g., Iris or breast cancer dataset); compare their performance using precision, recall, F1, and ROC-AUC curves.
- Train a random forest and gradient boosting model on the same dataset; visualize feature importance, tune hyperparameters (n_estimators, max_depth, learning_rate), and explain why ensemble methods outperform single trees.
- Apply K-means clustering and hierarchical clustering to an unlabeled dataset; determine the optimal number of clusters using the elbow method and silhouette analysis, then interpret the clusters.
- Perform PCA on a high-dimensional dataset to reduce dimensionality; visualize the explained variance ratio and reconstruct data from principal components to understand information loss.
- Design a neural network in Keras/TensorFlow for a regression or classification task; experiment with different architectures (layers, units, activation functions), use early stopping to prevent overfitting, and compare performance to simpler baselines.
Next up: This stage equips you with the mathematical understanding and hands-on skills to build, evaluate, and tune ML models responsibly; the next stage will likely focus on scaling these techniques to production systems, advanced architectures (CNNs, RNNs, transformers), or specialized domains (NLP, computer vision, time series), where you'll apply this foundation to more complex real-world problems.
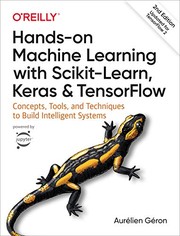
The most practical and complete ML book available — covers classical ML through deep learning with working code, building directly on the Python skills from Stage 2.

Provides the statistical theory behind the algorithms in Géron's book, ensuring you understand *why* models behave as they do, not just how to run them.
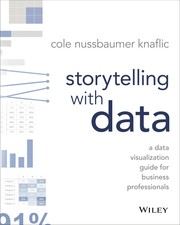
Teaches how to communicate model results and insights visually — a critical and often overlooked skill that separates good data scientists from great ones.
Portfolio, Career & Landing the Job
ExpertLearn how to structure end-to-end projects, present work to hiring managers, and navigate the data science job market strategically to land a role.
▸ Study plan for this stage
Pace: 4–5 weeks, ~25–30 pages/day, with 2–3 days per week dedicated to project work and job search activities
- Building a portfolio of end-to-end data science projects that demonstrate real-world problem-solving skills
- Structuring projects to show business impact, methodology, and technical depth for hiring managers
- Navigating the data science job market: identifying roles, understanding hiring criteria, and targeting opportunities
- Crafting a compelling personal brand and online presence (GitHub, LinkedIn, blog) to attract recruiters
- Interviewing strategies specific to data science: technical assessments, case studies, and behavioral questions
- Negotiating offers and evaluating roles based on growth potential, team dynamics, and career trajectory
- Transitioning into data science from adjacent fields and overcoming common career obstacles
- What are the core components of a strong data science portfolio, and how should each project be documented and presented?
- How do you structure an end-to-end project to demonstrate both technical skills and business acumen to hiring managers?
- What strategies should you use to identify and target data science roles that align with your skills and career goals?
- How do you build and maintain a personal brand that makes you visible and attractive to recruiters in the data science job market?
- What are the key types of technical interviews and assessments in data science hiring, and how should you prepare for them?
- How should you evaluate a data science job offer beyond salary, considering team, growth, and long-term career impact?
- Audit your current portfolio (GitHub, personal projects, Kaggle): identify 2–3 projects that best demonstrate end-to-end work and refactor them with clear documentation, business context, and impact metrics
- Build or refine one complete end-to-end project from problem definition through deployment, documenting every step and writing a case study explaining the business problem, methodology, and results
- Create or update your LinkedIn profile and GitHub presence to reflect your data science expertise; write 2–3 technical blog posts or Medium articles explaining a project or concept
- Conduct a job market analysis: research 10–15 data science roles at target companies, identify common skills and requirements, and map your current strengths and gaps
- Practice 3–5 technical interview scenarios (SQL/Python coding, case studies, take-home assignments) using real interview questions from Glassdoor, LeetCode, or similar platforms
- Conduct mock behavioral interviews with a peer or mentor, focusing on storytelling around your projects, handling failure, and demonstrating growth mindset
Next up: This stage equips you with a polished portfolio, job search strategy, and interview readiness—the practical tools needed to transition from learning data science to actively competing for and securing roles in the job market.

A practical, honest guide to the data science job market — covers portfolio building, interviews, and career strategy written by practitioners who have hired data scientists.
Rounds out the curriculum with real-world professional context — how data science actually works inside companies, bridging the gap between technical skill and workplace impact.
Discussion
Keep reading
Paths that share books, cover the same subject, or open a related topic.