Become a data analyst: the best books to break into the career
This curriculum takes a complete beginner from zero to job-ready data analyst across four progressive stages. It starts by building data intuition and spreadsheet fluency, moves into SQL and statistics, then advances into visualization and storytelling, and finally focuses on portfolio-building and career strategy — so every stage unlocks the next.
Foundations: Data Thinking & Spreadsheets
BeginnerUnderstand what data analysts actually do, develop a data-driven mindset, and become proficient with spreadsheets as a first analytical tool.
▸ Study plan for this stage
Pace: 8–10 weeks, ~25–30 pages/day (Naked Statistics: 4–5 weeks; Data Smart: 4–5 weeks)
- Data-driven thinking: how to ask the right questions and recognize bias, correlation vs. causation, and statistical fallacies in everyday claims
- Descriptive statistics fundamentals: mean, median, mode, standard deviation, and how to summarize data meaningfully
- Probability and distributions: understanding uncertainty, normal distribution, and how randomness affects data interpretation
- Spreadsheet as an analytical tool: formulas, pivot tables, data organization, and basic data manipulation in Excel/Google Sheets
- Real-world data problems: how to approach messy data, clean it, and extract actionable insights from it
- Statistical thinking in business: A/B testing, regression, clustering, and how analytics drives decision-making
- Data storytelling: presenting findings clearly so non-technical stakeholders understand and act on insights
- What is the difference between correlation and causation, and why do data analysts need to be skeptical of both?
- How would you explain standard deviation to a non-technical colleague, and when would you use it to assess data quality?
- What are the key steps in cleaning and organizing raw data in a spreadsheet before analysis?
- How do you use a pivot table to summarize data, and what business questions can it help answer?
- What is the purpose of A/B testing, and how would you design a simple experiment to test a hypothesis?
- How do you identify and handle outliers or anomalies in a dataset, and when should you remove vs. keep them?
- What does it mean to think like a data analyst, and how would you approach a vague business problem by breaking it down into data questions?
- Read Naked Statistics Chapters 1–3 and write a one-page reflection on a statistical claim you encounter in news or advertising—identify the bias, confounding variables, or logical fallacies
- Create a spreadsheet with 50+ rows of sample data (e.g., sales transactions, student grades, website metrics) and calculate mean, median, mode, and standard deviation for at least two columns; document what each metric reveals
- Build a pivot table from a provided dataset (or your own) to answer 3–4 business questions (e.g., 'Which product category has the highest average revenue?' or 'How many customers made repeat purchases?')
- Work through Data Smart's first case study (or a similar real-world dataset) end-to-end: import data, clean it, identify patterns, and write a 1-page summary of your findings and recommendations
- Design a simple A/B test for a hypothetical scenario (e.g., testing two email subject lines or website layouts); document your hypothesis, success metric, sample size, and how you'd interpret results
- Practice data cleaning: take a messy, real-world CSV or spreadsheet (with missing values, inconsistent formatting, duplicates) and document every step you take to prepare it for analysis
Next up: This stage equips you with statistical intuition and spreadsheet fluency—the mental models and hands-on skills needed to move into the next stage, where you'll learn programming languages and advanced analytics tools to scale beyond spreadsheets and tackle larger, more complex datasets.
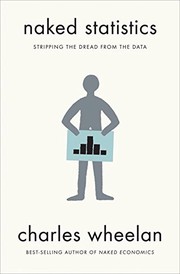
A friendly, jargon-free introduction to statistical thinking and why data matters — builds the intuition every analyst needs before touching any tool.
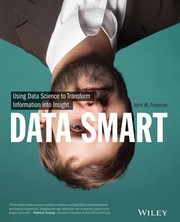
Teaches core data analysis concepts (clustering, regression, forecasting) entirely inside Excel/spreadsheets, making it the perfect bridge from everyday tools to analytical thinking.
SQL & Data Wrangling
BeginnerWrite confident SQL queries to extract, filter, aggregate, and join data from relational databases — the single most in-demand hard skill for entry-level analyst roles.
▸ Study plan for this stage
Pace: 8–10 weeks, ~25–30 pages/day (alternating between both books; start with "Learning SQL" for foundations, then layer in "SQL for Data Analysis" for applied techniques)
- SELECT, FROM, WHERE, and ORDER BY: the foundational clauses for retrieving and filtering data
- JOIN operations (INNER, LEFT, RIGHT, FULL OUTER): combining data from multiple tables and understanding how rows match
- Aggregate functions (COUNT, SUM, AVG, MIN, MAX) and GROUP BY: summarizing data and identifying patterns
- Subqueries and CTEs (Common Table Expressions): breaking complex queries into readable, reusable logic
- Window functions (ROW_NUMBER, RANK, LAG, LEAD): performing calculations across ordered rows without collapsing groups
- Data type handling and NULL logic: avoiding silent errors and ensuring data integrity in queries
- Query optimization basics: writing efficient queries that run fast on large datasets
- Real-world analysis patterns: cohort analysis, retention metrics, and time-series aggregations for business questions
- Write a query that joins two tables on a foreign key, filters by a date range, and returns aggregated results grouped by a categorical column—explain why you chose INNER vs. LEFT JOIN.
- How would you use a window function instead of a subquery to calculate a running total or rank rows within a partition? What are the performance trade-offs?
- Given a messy dataset with NULLs and inconsistent data types, how would you clean and validate it in SQL before analysis?
- Design a query to answer a real business question (e.g., 'What is the monthly retention rate for users acquired in Q1?') using CTEs, aggregates, and joins.
- Explain the difference between WHERE and HAVING clauses—when would you use each, and what happens if you mix them up?
- How would you optimize a slow query that joins three large tables and filters millions of rows?
- Complete all hands-on exercises in 'Learning SQL' (Chapters 2–8): write SELECT, WHERE, JOIN, and GROUP BY queries against the provided sample database; focus on understanding *why* each clause is needed.
- Replicate the cohort analysis example from 'SQL for Data Analysis' (Chapter 4) using a public dataset (e.g., Kaggle or your own sample data); modify the date ranges and metrics to deepen understanding.
- Write 5 queries to answer progressively harder business questions: (1) simple filter, (2) single join + aggregate, (3) multiple joins + GROUP BY, (4) subquery or CTE, (5) window function for ranking or running totals.
- Debug and fix 3–5 broken queries: identify missing JOINs, incorrect GROUP BY logic, NULL handling errors, or performance issues; explain the fix.
- Build a mini-project: extract, clean, and analyze a real dataset (e.g., sales, user behavior, or public data) using all techniques learned—write 3–4 queries that answer distinct business questions and document your findings.
- Practice query optimization: take a slow query you've written and rewrite it using indexes, CTEs, or window functions; measure the performance improvement.
Next up: Mastery of SQL and data wrangling equips you to reliably extract and shape raw data, setting the stage for the next phase—exploratory data analysis and visualization—where you'll interpret patterns and communicate insights to stakeholders.

The most thorough beginner-to-intermediate SQL book in print; covers every clause, join type, and subquery pattern an analyst will use daily.

Picks up where Learning SQL leaves off by applying SQL to real analytical problems — time-series analysis, cohorts, funnels — exactly what analysts do on the job.
Statistics & Python for Analysis
IntermediateApply descriptive and inferential statistics rigorously, and use Python (pandas, NumPy) to analyze datasets too large or complex for spreadsheets.
▸ Study plan for this stage
Pace: 8–10 weeks, ~40–50 pages/day with active coding practice
- NumPy arrays and vectorized operations as the foundation for numerical computing
- Pandas DataFrames and Series for data manipulation, cleaning, and reshaping
- Groupby operations and aggregation for exploratory data analysis
- Merging, joining, and concatenating datasets from multiple sources
- Time series data handling and resampling in pandas
- Data cleaning techniques: handling missing values, duplicates, and outliers
- Descriptive statistics: calculating summary statistics and distributions
- Introduction to statistical thinking through exploratory analysis with real datasets
- How do NumPy arrays differ from Python lists, and why are vectorized operations more efficient for numerical analysis?
- What is a pandas DataFrame and how does it differ from a Series? How would you construct one from different data sources?
- How do you use groupby() to segment data and compute aggregate statistics by group?
- What are the main strategies for handling missing data in pandas, and when would you use each approach?
- How do you merge or join multiple datasets, and what are the differences between inner, outer, left, and right joins?
- How would you clean and prepare a real-world dataset for analysis, and what are common data quality issues you'd encounter?
- Work through McKinney's NumPy chapters: create arrays, perform element-wise operations, reshape data, and compare performance against Python loops
- Load a real CSV dataset (e.g., from Kaggle or UCI Machine Learning Repository) into a pandas DataFrame and explore its structure, dtypes, and basic info()
- Practice groupby aggregations: calculate mean, median, and standard deviation by multiple grouping columns; create pivot tables
- Clean a messy dataset: identify and handle missing values using fillna(), dropna(), and interpolation; remove duplicates; detect outliers
- Merge two related datasets using merge() or join() with different join types; practice on a scenario with multiple tables (e.g., customers and orders)
- Perform time series resampling: load a time-indexed dataset, resample to different frequencies, and calculate rolling statistics
- Reproduce one complete analysis example from McKinney's case studies: load data, clean it, group and aggregate, and produce summary statistics
- Build a data pipeline: read raw data, apply multiple transformation steps (filtering, grouping, merging), and export cleaned results to CSV
Next up: This stage equips you with the Python tools and data manipulation skills necessary to prepare and explore datasets rigorously; the next stage will layer statistical inference and hypothesis testing on top of these cleaned, well-understood datasets.
A rigorous but accessible statistics textbook that cements probability, distributions, hypothesis testing, and regression — the analytical backbone behind every dashboard and report.
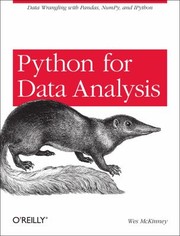
Written by the creator of pandas, this is the definitive hands-on guide to data wrangling in Python — a must-read once statistical concepts are solid.
Visualization & Storytelling with Data
IntermediateDesign clear, honest, and persuasive charts and dashboards, and learn to communicate analytical findings to non-technical stakeholders.
▸ Study plan for this stage
Pace: 8–10 weeks, ~25–30 pages/day (approximately 4–5 hours/week of reading and reflection)
- The importance of context and audience in data visualization design
- Eliminating clutter and using pre-attentive processing to guide viewer attention
- Color theory and its role in highlighting, categorizing, and conveying meaning in charts
- Narrative structure: how to sequence visualizations to tell a coherent story with data
- The functional vs. decorative balance in information graphics
- Choosing appropriate chart types based on the story you want to tell and the data relationships you need to show
- Designing dashboards that prioritize user action and decision-making over aesthetic complexity
- Ethical considerations: representing data honestly and avoiding misleading visualizations
- How do you determine the right level of detail and visual complexity for your audience, and what is the role of context in that decision?
- What is pre-attentive processing, and how can you use it to direct a viewer's attention to the most important insights in a chart?
- How do you choose between different chart types, and what are the trade-offs between clarity and aesthetic appeal?
- What makes a dashboard functional versus decorative, and how do you design one that drives action?
- How can you use narrative structure and sequencing to transform raw data insights into a persuasive story?
- What are the ethical responsibilities of a data analyst when visualizing data, and how do you avoid common pitfalls like misleading scales or inappropriate color choices?
- Redesign a poorly designed chart from a news article or report: identify the clutter, apply pre-attentive processing principles, and create a clearer version
- Create a 3–5 slide data story on a topic of your choice, sequencing visualizations to build a narrative arc with a clear insight and call to action
- Experiment with color palettes: take a single dataset and visualize it using different color schemes (sequential, diverging, categorical) and reflect on how each changes the interpretation
- Build a functional dashboard prototype (using Tableau, Power BI, or even a static mockup) for a specific user persona and decision-making context; include only the metrics that drive action
- Analyze a visualization from a TED talk or data journalism piece: identify the narrative structure, the chart types used, and how pre-attentive processing guides your eye
- Critique a peer's visualization or dashboard using the principles from both books: provide feedback on audience alignment, clutter, color use, and narrative clarity
- Recreate a chart from 'Storytelling with Data' or 'The Functional Art' and then modify it for a different audience (e.g., executives vs. technical analysts) to practice context-driven design
Next up: This stage equips you with the visual and narrative tools to communicate analytical findings persuasively; the next stage will deepen your ability to choose and apply advanced analytical methods that generate the insights worth visualizing and storytelling in the first place.
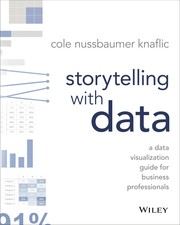
The go-to book for analysts on choosing the right chart, eliminating clutter, and building a narrative — directly applicable to any BI tool or presentation.
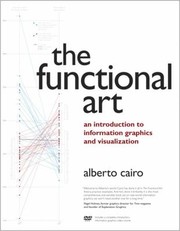
Deepens visualization literacy by explaining the perceptual and design principles behind effective graphics, elevating work from competent to compelling.
Portfolio, Career Strategy & Professional Skills
ExpertBuild a job-ready portfolio, understand the analyst hiring process, and develop the business communication and problem-framing skills that separate hired candidates from the rest.
▸ Study plan for this stage
Pace: 8–10 weeks, ~40–50 pages/day (mix of reading and portfolio work)
- Portfolio construction: selecting, scoping, and presenting projects that demonstrate real-world impact and hiring-relevant skills
- The data science hiring funnel: resume screening, take-home assignments, technical interviews, and culture fit evaluation
- Framing data problems: translating business questions into analytical hypotheses and defining success metrics before diving into analysis
- Communicating findings to non-technical stakeholders: structuring narratives, choosing visualizations, and building persuasive arguments with data
- Career strategy: identifying your analyst archetype, positioning yourself in the job market, and networking effectively
- Iterative problem-solving: how to scope projects, validate assumptions, and pivot when data doesn't support initial hypotheses
- Building credibility: documenting your work, explaining your reasoning, and demonstrating domain knowledge alongside technical skills
- What makes a portfolio project 'hiring-ready,' and how do you select projects that demonstrate both technical depth and business impact?
- How does the hiring process differ across data analyst roles, and what specific skills or artifacts does each stage evaluate?
- What is the difference between a business question and an analytical question, and why does this distinction matter when framing a problem?
- How do you structure a data-driven narrative for a non-technical audience, and what role do visualizations play in persuasion?
- What is your analyst archetype (e.g., generalist, specialist, storyteller), and how should you position yourself in the job market based on your strengths?
- How do you validate that your analysis is answering the right question, and what should you do when initial hypotheses are disproven?
- Audit your current portfolio (or start one): select 2–3 projects and reframe them using the business-to-analytical question hierarchy from 'Thinking with Data'; document the problem statement, hypothesis, and success metrics for each
- Conduct a mock hiring interview: record yourself explaining one portfolio project to a non-technical stakeholder (imagine a hiring manager), then review for clarity, jargon, and persuasiveness
- Redesign a portfolio project's presentation: take an existing analysis and create a one-page executive summary, a 5-minute verbal pitch, and a polished visualization that tells the story without requiring code
- Build a 'hiring roadmap': map out 3–5 target analyst roles, identify the skills and artifacts each role values, and plan 1–2 portfolio projects that directly address those gaps
- Practice problem-scoping: take 3 real-world business scenarios (from case studies or your own experience) and write out the business question → analytical question → success metrics for each
- Create a personal 'analyst positioning statement': define your archetype, key strengths, and the types of problems you solve best; use this to craft a compelling LinkedIn summary and elevator pitch
Next up: This stage equips you with a job-ready portfolio, a clear understanding of how hiring works, and the communication skills to land interviews—preparing you to either enter the job market confidently or deepen specialized technical expertise in your chosen analyst domain.

Covers the full analyst/data-science job search end-to-end — portfolio projects, resume, interviews, and salary negotiation — written specifically for people breaking into the field.

Teaches how to scope and frame analytical problems like a senior analyst, ensuring portfolio projects demonstrate business impact rather than just technical skill.
Discussion
Keep reading
Paths that share books, cover the same subject, or open a related topic.