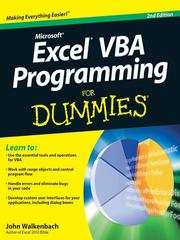
Data analytics: a reading path from raw data to real insight
This curriculum takes a complete beginner from zero to confident data analyst across four progressive stages. Each stage builds on the last — starting with statistical intuition and spreadsheet thinking, moving through Python-powered data wrangling and visualization, then into rigorous statistical analysis, and finally into decision-making and storytelling with data. By the end, the learner can handle a full analytics project end to end.
Foundations: Thinking with Data
BeginnerBuild statistical intuition, learn to ask the right questions, and understand what data analysis actually means before touching any tools.
▸ Study plan for this stage
Pace: 8–10 weeks, ~25–30 pages/day (approximately 2–3 weeks per book with reflection time)
- Statistical thinking as a lens for understanding the world: recognizing variation, uncertainty, and probability in everyday decisions
- Descriptive vs. inferential statistics: the difference between summarizing data and drawing conclusions about populations
- Common statistical pitfalls and misinterpretations: correlation vs. causation, selection bias, confounding variables, and p-hacking
- How statistics can be deliberately or accidentally misused: cherry-picking data, misleading visualizations, and flawed study design
- The role of context and storytelling in data analysis: why the numbers alone don't tell the full story
- Probability and risk literacy: understanding odds, expected value, and how to evaluate claims about likelihood
- The importance of asking the right questions before analyzing data: defining the problem, identifying what you actually want to know
- Why is correlation not the same as causation, and what are some real-world examples where confusing the two leads to wrong conclusions?
- How can the same dataset be presented in multiple ways to support different narratives? Give examples from the books and from your own observations.
- What is the difference between a statistic and a parameter, and why does this distinction matter when making claims about a population?
- Describe three common ways statistics can be misused or misinterpreted. How would you spot these tricks in a news article or marketing claim?
- What questions should you ask about a dataset or study before trusting its conclusions? (Consider: Who collected it? Why? How? What's missing?)
- Explain the concept of statistical uncertainty and why 'proving' something with data is different from proving it mathematically.
- Read a news article citing statistics or a study. Identify the underlying question being asked, the data used, potential biases, and alternative explanations for the findings. Write a one-page critique.
- Find three examples of misleading graphs or statistics in advertising, news, or social media. Explain what's misleading and how you'd present the same information more honestly.
- Collect a simple dataset from your own life (e.g., daily coffee spending, sleep hours, exercise minutes over 2 weeks). Calculate the mean, median, and standard deviation. Reflect on what these numbers reveal and what they hide.
- Take a claim you encounter ("X causes Y" or "9 out of 10 dentists recommend..."). Work backwards to design what the study might have looked like. What could be wrong with it?
- Interview someone about a decision they made based on data or statistics. Ask them what numbers they saw, what they concluded, and whether they considered alternative explanations. Summarize your findings.
- Create a simple survey question and ask 20–30 people. Analyze the results and write a short report. Reflect on how your question wording, sample size, and who you asked might have biased the results.
Next up: This stage equips you with the critical thinking skills and statistical intuition needed to evaluate data claims and understand *why* analysis matters before learning the technical tools and methods that will let you perform your own analyses.
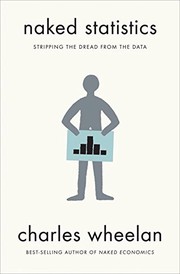
A jargon-free, story-driven introduction to statistics that builds genuine intuition about probability, correlation, and inference — essential mental models before any technical work begins.

A short, classic read that trains the learner to spot misleading data and charts, developing critical thinking that underpins every later stage of analysis.

Bridges everyday questions and rigorous statistical thinking, introducing concepts like distributions, regression, and uncertainty in an accessible, modern way — the perfect capstone to this stage.
Tools: Python for Data Analysis
BeginnerLearn to load, clean, explore, and manipulate real datasets programmatically using Python and the pandas library.
▸ Study plan for this stage
Pace: 8–10 weeks, ~40–50 pages/day (mix of reading and coding practice)
- Python fundamentals: variables, data types, control flow, and functions for automating data tasks
- Working with files and I/O: reading, writing, and parsing data from CSV, Excel, and text formats
- NumPy arrays and vectorized operations as the foundation for efficient numerical computing
- Pandas DataFrames and Series: loading, indexing, selecting, and filtering data
- Data cleaning and transformation: handling missing values, duplicates, type conversions, and reshaping
- Exploratory data analysis: descriptive statistics, grouping, aggregation, and basic visualization
- Combining and merging datasets: concatenation, joins, and relational operations
- How do you load a CSV file into a pandas DataFrame and inspect its structure and contents?
- What are the main differences between NumPy arrays and pandas Series/DataFrames, and when would you use each?
- How do you identify, handle, and remove missing values and duplicates in a dataset?
- What methods would you use to filter, subset, and select specific rows and columns from a DataFrame?
- How do you group data by one or more columns and compute aggregate statistics (sum, mean, count)?
- What are the key steps in a typical data cleaning workflow, and how do you automate them with Python?
- How do you merge or join two datasets on common columns, and what are the different join types?
- Complete the automation exercises in 'Automate the Boring Stuff' (Chapters 8–10) to build file handling and string manipulation skills
- Load a real-world CSV dataset (e.g., from Kaggle) and write a script to inspect shape, columns, data types, and summary statistics
- Clean a messy dataset by identifying and handling missing values, duplicates, and inconsistent data types using pandas methods
- Practice DataFrame indexing and selection: filter rows by conditions, select columns by name/position, and use .loc and .iloc
- Perform a groupby aggregation task: group a dataset by a categorical column and compute multiple aggregate functions (mean, sum, count)
- Merge two related datasets (e.g., customer and order data) using different join types and verify the results
- Build an end-to-end data pipeline: load raw data, clean it, explore it with descriptive statistics and grouping, and export the cleaned result to a new CSV file
Next up: This stage equips you with the core skills to programmatically acquire, clean, and explore real data—the essential foundation for the next stage, where you'll apply statistical analysis and visualization techniques to extract meaningful insights from prepared datasets.
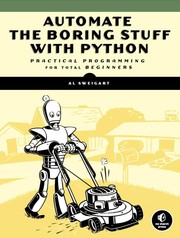
Provides a painless, practical introduction to Python programming with zero assumed experience — gives the learner just enough coding fluency to move into data-specific libraries.
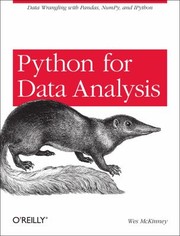
Written by the creator of pandas, this is the definitive guide to data wrangling in Python — covers loading, cleaning, reshaping, and aggregating datasets, which is the core daily work of an analyst.
Exploration & Visualization: Seeing the Data
IntermediateMaster exploratory data analysis (EDA) and learn to create clear, accurate, and compelling visualizations that communicate findings to any audience.
▸ Study plan for this stage
Pace: 8–10 weeks, ~40–50 pages/day, with 2–3 days per week dedicated to hands-on visualization projects
- The narrative structure of data storytelling: understanding your audience, defining the key message, and choosing the right visual form to support it
- Principles of effective visualization design: color theory, typography, layout, and avoiding chartjunk to maximize clarity and impact
- Common visualization types and when to use them: bar charts, line graphs, scatter plots, heatmaps, and distributions—matching the data structure to the story
- Exploratory Data Analysis (EDA) workflows: summarizing data, identifying patterns, outliers, and relationships before visualization
- Matplotlib and Seaborn fundamentals: creating, customizing, and iterating on visualizations programmatically in Python
- Accessibility and inclusive design in data visualization: ensuring color-blind friendly palettes, readable fonts, and clear legends
- The psychology of perception: how humans read charts, the role of pre-attentive attributes (color, size, position), and cognitive load
- Iterative refinement: moving from exploratory sketches to polished, publication-ready visualizations that tell a coherent story
- How do you identify your audience and key message before creating a visualization, and why does this matter?
- What are the main principles of effective visualization design, and how do you apply them to reduce cognitive load?
- When would you use a bar chart versus a line graph versus a scatter plot, and what does each reveal about your data?
- What is exploratory data analysis, and what are the key steps you take before creating a final visualization?
- How do you use Matplotlib and Seaborn to create, customize, and iterate on visualizations in Python?
- What design choices make a visualization accessible to color-blind viewers and readers with varying visual abilities?
- How do pre-attentive attributes (color, size, position) influence how viewers interpret a chart, and how do you leverage this in design?
- Read 'Storytelling with Data' and annotate 5–7 examples of effective and ineffective visualizations from the book, noting what works and why
- Redesign 3 'bad' visualizations from 'Storytelling with Data' using principles from 'Fundamentals of Data Visualization'; create before/after comparisons with written justifications
- Load a real dataset (e.g., Iris, Titanic, or a public Kaggle dataset) and perform a complete EDA using Python: compute summary statistics, check for missing values, and identify distributions and correlations
- Create a series of 5–6 exploratory visualizations of the same dataset using different chart types (bar, line, scatter, histogram, heatmap) and write a brief analysis of what each reveals
- Design a data story around a dataset of your choice: write a 1–2 page narrative, identify the key message, and create 3–4 polished visualizations that support that story
- Implement color-blind friendly palettes in a visualization using Seaborn or Matplotlib; test your design with a color-blindness simulator and document the changes
- Critique a published data visualization (from news, research, or business) using frameworks from both books; identify strengths, weaknesses, and how you would redesign it
Next up: This stage equips you with the visual communication and exploratory skills to uncover and present insights, preparing you to move into deeper statistical analysis, modeling, and predictive analytics where you'll need to validate and explain complex patterns.
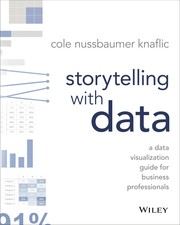
Teaches the principles of effective data visualization — choosing the right chart, removing clutter, and guiding the audience's eye — skills that transform raw plots into persuasive communication.

A comprehensive, tool-agnostic reference for when and how to use every major chart type, grounded in perception science — the perfect complement to Knaflic's design-focused approach.

Covers NumPy, pandas, Matplotlib, and scikit-learn in one cohesive volume, giving the learner the practical Python toolkit to actually implement EDA and visualization on real datasets.
Statistics & Inference: Rigorous Analysis
IntermediateApply formal statistical methods — hypothesis testing, regression, and probability — to draw defensible, reproducible conclusions from data.
▸ Study plan for this stage
Pace: 8–10 weeks, ~40–50 pages/day (Freedman first: 4–5 weeks; Bruce second: 3–4 weeks). Allocate 2–3 days per major concept for integration and practice.
- Probability foundations: sample spaces, conditional probability, independence, and Bayes' theorem as the basis for statistical inference
- Sampling distributions and the Central Limit Theorem: why sample statistics approximate population parameters and enable hypothesis testing
- Hypothesis testing framework: null/alternative hypotheses, p-values, significance levels, Type I/II errors, and power—with emphasis on correct interpretation
- Confidence intervals and estimation: constructing and interpreting intervals that quantify uncertainty in parameter estimates
- Linear regression: fitting models, interpreting coefficients, assessing fit (R², residuals), and understanding regression as conditional expectation
- Practical statistical pitfalls: confounding, selection bias, multiple testing corrections, and when statistical significance ≠ practical significance
- Reproducibility and communication: documenting assumptions, reporting effect sizes alongside p-values, and avoiding common misinterpretations
- Probability distributions and their applications: normal, binomial, chi-square, t-distribution—when and why to use each in inference
- Explain why the Central Limit Theorem matters for hypothesis testing and what assumptions must hold for it to apply.
- Design a hypothesis test for a real-world question: state the null and alternative hypotheses, choose an appropriate test, interpret a p-value correctly, and explain what you can and cannot conclude.
- Given a regression output, interpret the slope coefficient, R², residual plots, and confidence intervals—and identify when the model may be inappropriate.
- What is the difference between statistical significance and practical significance? Give an example where a result is statistically significant but not practically meaningful.
- Describe three common sources of bias in data collection or analysis (e.g., confounding, selection bias, multiple testing) and how to detect or mitigate them.
- Construct and interpret a 95% confidence interval for a population mean or proportion; explain what 'confidence' means and what it does not mean.
- Work through Freedman's probability and sampling distribution chapters with pen and paper: calculate conditional probabilities, simulate the Central Limit Theorem with dice or code, and verify that sample means converge to the population mean.
- Conduct a complete hypothesis test on a provided dataset (or one you collect): state hypotheses, check assumptions, compute the test statistic and p-value, and write a one-paragraph conclusion that avoids p-value misinterpretation.
- Fit a linear regression model to a real dataset using R, Python, or similar; interpret coefficients, examine residual plots for violations of assumptions, and report confidence intervals alongside point estimates.
- Replicate a published data analysis from a news article or research paper: identify the statistical methods used, check whether conclusions match the evidence, and note any potential confounders or biases.
- Practice multiple hypothesis testing correction: perform 10+ tests on a single dataset and apply Bonferroni or FDR correction; compare raw and corrected p-values and discuss when correction matters.
- Create a 'statistical audit' of a flawed analysis: identify errors in hypothesis framing, p-value interpretation, or regression assumptions, and rewrite the conclusions correctly.
Next up: This stage equips you with the formal statistical toolkit to test claims and quantify uncertainty; the next stage will extend these methods to machine learning, causal inference, and high-dimensional data—where you'll apply regression, classification, and resampling techniques to prediction and decision-making under realistic constraints.
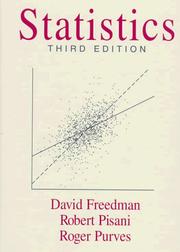
A rigorous yet readable university-level statistics text that formalizes the intuitions built in Stage 1, covering probability, sampling, and inference with real examples and careful reasoning.

Translates classical statistics directly into the data science workflow with R and Python examples, covering resampling, regression, and classification — bridging theory and applied analysis.
Decision-Making: Turning Numbers into Action
ExpertSynthesize everything into a strategic mindset — frame business problems, communicate insights to stakeholders, and drive real decisions with data.
▸ Study plan for this stage
Pace: 8–10 weeks, ~40–50 pages/day (alternating between both books; ~2 weeks per book with overlap for synthesis)
- System 1 vs. System 2 thinking: recognizing cognitive biases and when to engage deliberate analysis in decision-making
- Anchoring, availability bias, and overconfidence: how mental shortcuts distort data interpretation and business judgment
- The analytics capability maturity model: assessing organizational readiness and competitive positioning through data
- Building an analytics-driven culture: embedding data literacy and analytical thinking across all business functions
- Translating analytical findings into strategic action: framing insights for stakeholder buy-in and organizational change
- Competitive advantage through analytics: using data as a defensible differentiator in market competition
- Behavioral economics applied to business: designing decision-making processes that account for human psychology
- Storytelling with data: communicating complex analytical results to non-technical audiences for impact
- How do System 1 and System 2 thinking affect how business leaders interpret data, and what strategies can you use to mitigate cognitive biases in decision-making?
- What are the key organizational capabilities required to compete on analytics, and how would you assess your organization's current maturity level?
- How would you design a business case using data to convince a skeptical executive stakeholder to adopt a data-driven strategy?
- Describe a real business problem you could frame analytically: what data would you need, what biases might cloud interpretation, and how would you present findings to drive action?
- What is the relationship between organizational culture and analytics success, and what barriers typically prevent analytics adoption?
- How do cognitive biases like anchoring and overconfidence specifically undermine analytics initiatives, and what safeguards can you build into analytical processes?
- Cognitive bias audit: Identify 3–5 recent business decisions in your organization (or a case study). For each, diagnose which System 1 biases (anchoring, availability, overconfidence) likely influenced the decision, then sketch how System 2 analysis could have improved the outcome.
- Analytics maturity assessment: Map your organization (or a company you know well) against Davenport's maturity model. Identify current stage, gaps, and a 12–18 month roadmap to advance one level, including required capabilities and investments.
- Stakeholder communication exercise: Take a complex analytical finding (e.g., customer churn drivers, pricing elasticity, or campaign ROI). Write two versions: (1) a technical summary for analysts, (2) a 1-page narrative with visuals for C-suite. Reflect on what changed and why.
- Bias-proofing an analysis: Design an analytical process for a high-stakes business decision (e.g., market entry, product launch, cost reduction). Explicitly identify where cognitive biases could creep in and build in safeguards (e.g., pre-mortems, devil's advocate, independent review).
- Competitive analytics case study: Analyze a company known for analytics excellence (e.g., Amazon, Netflix, Uber). Identify: their core analytical capabilities, how they embed analytics in culture, and how this creates competitive moat. Compare to a competitor lacking analytics advantage.
- Personal decision journal: Over 2–3 weeks, log 5–10 significant decisions you make (work or personal). For each, note: what data you used, which System 1 biases you notice in hindsight, and how System 2 thinking could have improved the choice.
Next up: This stage equips you to recognize the human and organizational dimensions of data-driven strategy; the next stage will likely deepen technical execution—building scalable analytics infrastructure, advanced modeling, or specialized domains—knowing that technical excellence alone fails without the strategic mindset and stakeholder alignment you've now mastered.
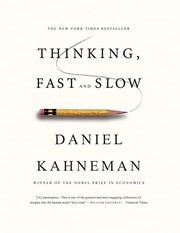
Reveals the cognitive biases that distort how humans interpret data and make decisions, making the analyst a far more effective communicator and advisor to non-technical stakeholders.

Shows how organizations build analytics capabilities and use data as a strategic asset — gives the learner a business-level framework for positioning their analytical work for maximum impact.
Discussion
Keep reading
Paths that share books, cover the same subject, or open a related topic.