How to learn Data science
This curriculum takes a complete beginner from zero data science knowledge to professional-level mastery across four carefully sequenced stages. Each stage builds on the last — first developing statistical and programming intuition, then core data science practice, then machine learning depth, and finally the communication and engineering skills that separate good data scientists from great ones.
Foundations: Math, Stats & Python
BeginnerBuild the essential vocabulary in statistics, probability, and Python programming that all data science work rests on.
▸ Study plan for this stage
Pace: 8–10 weeks total. Weeks 1–5: "Automate the Boring Stuff with Python" (~40–50 pages/day, focusing on Chapters 1–11 for core Python, then skimming Chapters 12–20 for awareness of automation tools). Weeks 6–10: "Think Stats" (~20–25 pages/day, reading slowly and re-running every code example in the acc
- Python fundamentals: variables, data types, control flow (if/else, for/while loops), and functions as covered in Automate the Boring Stuff
- Data structures in Python: lists, dictionaries, sets, and tuples — the containers you will use to hold datasets
- File I/O and basic automation: reading/writing CSV and text files with Python, which is the entry point to real data ingestion
- Descriptive statistics: mean, median, mode, variance, and standard deviation as explored through real datasets in Think Stats
- Probability distributions: PMFs (Probability Mass Functions), CDFs (Cumulative Distribution Functions), and PDFs — the core language of Think Stats
- Exploratory Data Analysis (EDA): how to summarize, visualize, and sanity-check a dataset before modeling, as practiced throughout Think Stats
- Correlation vs. causation: understanding what statistical relationships do and do not imply, a central theme in Think Stats
- Hypothesis testing and statistical thinking: null hypotheses, p-values, and resampling methods introduced in Think Stats
- After reading Automate the Boring Stuff, can you write a Python script from scratch that reads a CSV file, filters rows based on a condition, and writes the results to a new file?
- What is the difference between a list and a dictionary in Python, and when would you choose one over the other for storing data?
- How does Think Stats define a PMF, and how does it differ from a CDF? When is each more useful for understanding a distribution?
- What is the difference between variance and standard deviation, and why does Think Stats prefer to work with both rather than just one?
- How would you use the resampling / permutation test approach from Think Stats to decide whether an observed difference between two groups is statistically significant?
- What does Think Stats mean when it warns that 'correlation does not imply causation,' and what is one concrete example from the book that illustrates this?
- **Python drill (Automate the Boring Stuff, Chs. 1–6):** Write a script that asks the user for a list of numbers, computes the mean and median manually (without importing any stats library), and prints whether each number is above or below the mean — reinforcing both Python basics and descriptive stats simultaneously.
- **File automation project (Automate the Boring Stuff, Chs. 8–9):** Download a public CSV dataset (e.g., NSFG birth data used in Think Stats), write a Python script to open it, parse each row into a dictionary, and print a summary of how many rows were loaded and what columns exist.
- **PMF from scratch (Think Stats, Ch. 2–3):** Using only Python dictionaries and the NSFG dataset, manually build a PMF for a variable of your choice (e.g., birth weight). Plot it using a simple print-based histogram before reaching for any plotting library.
- **CDF comparison exercise (Think Stats, Ch. 4):** Compute and plot the CDFs for two subgroups in the Think Stats dataset (e.g., first babies vs. others for pregnancy length). Write two sentences interpreting what the CDF shapes tell you about the difference between the groups.
- **Correlation investigation (Think Stats, Ch. 7):** Pick two numerical variables from the dataset, compute their Pearson correlation coefficient by hand using the formula, then verify with Python. Write a short paragraph arguing whether the correlation implies any causal relationship and why.
- **Hypothesis test replication (Think Stats, Ch. 9):** Replicate the permutation/resampling hypothesis test from Think Stats on a chosen variable. Vary the number of iterations (100, 1,000, 10,000) and record how the estimated p-value stabilizes — then explain in plain English what the result means.
Next up: Mastering Python scripting and statistical fundamentals here gives you the hands-on coding fluency and probabilistic vocabulary needed to move confidently into data manipulation and visualization libraries (such as pandas, NumPy, and Matplotlib) in the next stage.
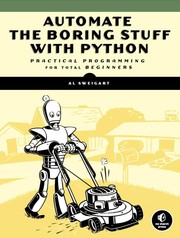
A friendly, practical introduction to Python that gets beginners writing real code immediately — no prior programming experience needed. It establishes the Python fluency required for every later book.
Builds genuine statistical intuition — mean, variance, distributions, hypothesis testing — through clear prose and examples before any code is introduced, ensuring concepts are understood, not just copied.
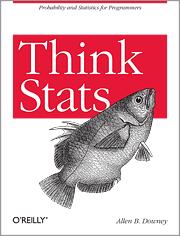
Bridges the gap between pure statistics and Python by teaching exploratory data analysis and probability through hands-on coding, perfectly preparing the reader for data-centric libraries.
Core Data Science Practice
BeginnerLearn to acquire, clean, explore, and visualize real datasets using the standard Python data science stack (pandas, NumPy, Matplotlib).
▸ Study plan for this stage
Pace: 8–10 weeks total: Weeks 1–6 cover "Python for Data Analysis" (~40–50 pages/day, 4–5 days/week), focusing on hands-on coding alongside the text; Weeks 7–10 cover "Storytelling with Data" (~25–30 pages/day, 3–4 days/week), which is lighter but demands active reflection and sketch-based practice after
- NumPy ndarray fundamentals: vectorized operations, broadcasting, and array indexing/slicing (Python for Data Analysis, Ch. 4)
- pandas Series and DataFrame: creation, indexing (loc/iloc), alignment, and the mental model of labeled data (Python for Data Analysis, Ch. 5)
- Data loading and storage: reading/writing CSV, Excel, and JSON with pandas I/O tools (Python for Data Analysis, Ch. 6)
- Data cleaning and preparation: handling missing values, deduplication, type casting, string operations, and apply/map transformations (Python for Data Analysis, Ch. 7)
- Data wrangling: reshaping, merging, joining, groupby split-apply-combine, and pivot tables (Python for Data Analysis, Ch. 8–10)
- Exploratory Data Analysis (EDA) with Matplotlib: line, bar, scatter, and histogram plots; subplots and figure aesthetics (Python for Data Analysis, Ch. 9)
- Choosing the right chart type for the data relationship being communicated (Storytelling with Data, Ch. 2)
- Eliminating clutter and directing audience attention using preattentive attributes and the principle of visual hierarchy (Storytelling with Data, Ch. 3–5)
- Given a raw CSV with mixed types, nulls, and duplicate rows, what is the step-by-step pandas workflow you would use to produce a clean, analysis-ready DataFrame — and which specific methods from Python for Data Analysis would you call at each step?
- How does the pandas groupby mechanism implement the split-apply-combine pattern, and when would you use agg(), transform(), or apply() on a GroupBy object?
- Knaflic argues that most dashboards and reports contain too much clutter. What specific elements does she identify as clutter, and what is her process for deciding what to remove?
- What are preattentive attributes as defined in Storytelling with Data, and how can you deliberately use color, size, or position in a Matplotlib chart to guide a viewer's eye to the most important finding?
- When would you choose a small-multiple (faceted) chart over a single chart with multiple series, and how would you implement small multiples using Matplotlib subplots as shown in Python for Data Analysis?
- How do the data-wrangling skills from Python for Data Analysis and the visual design principles from Storytelling with Data work together in a complete EDA-to-presentation workflow?
- **Dirty Dataset Cleanup (Python for Data Analysis):** Download a messy real-world CSV (e.g., from Kaggle or data.gov). Use pandas to: load it, audit dtypes and null counts, impute or drop missing values, remove duplicates, and rename/recast columns — documenting every decision in a Jupyter notebook.
- **GroupBy Deep-Dive (Python for Data Analysis):** Using the cleaned dataset, write at least five distinct groupby pipelines — one each using agg(), transform(), apply(), pivot_table(), and a multi-level groupby — and print a plain-English interpretation of each result.
- **EDA Plot Sprint (Python for Data Analysis + Storytelling with Data):** Produce 8–10 exploratory Matplotlib charts (distributions, correlations, time trends, category comparisons) for your dataset. For each chart, write one sentence describing what you see — practicing the habit Knaflic calls 'so what?'
- **Chart Makeover (Storytelling with Data):** Find a cluttered chart online (news article, Reddit r/dataisugly). Recreate it in Matplotlib, then apply Knaflic's decluttering checklist: remove chartjunk, reduce color palette to 1–2 purposeful colors, add a descriptive title that states the insight, and annotate the key data point.
- **Storytelling Notebook (Storytelling with Data):** Choose one finding from your EDA and build a 5–6 cell Jupyter narrative: context → conflict → resolution, using only the charts and text needed to support that single insight — no extra plots allowed.
- **End-to-End Mini-Project:** Pick a new public dataset, complete the full pipeline — load, clean, wrangle with pandas/NumPy, explore with Matplotlib, then produce a 3-slide (or 3-section notebook) story following Knaflic's structure — and share it for peer or mentor feedback.
Next up: Mastering the acquire-clean-explore-visualize loop with pandas, NumPy, and Matplotlib — and learning to communicate findings clearly — gives the reader the practical fluency and analytical intuition needed to move into statistical thinking, machine learning feature engineering, or more advanced data storytelling in the next stage.
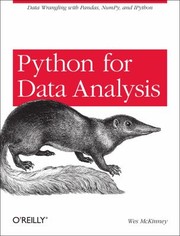
Written by the creator of pandas, this is the definitive guide to data wrangling in Python. Reading it here turns statistical knowledge into practical data manipulation skill.
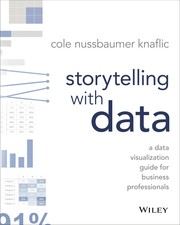
Teaches the principles of effective data visualization and communication — a critical skill often skipped in technical curricula — so that analysis can actually influence decisions.
Machine Learning: Concepts to Code
IntermediateUnderstand the theory and practical application of core machine learning algorithms, and learn to build, evaluate, and tune models with scikit-learn.
▸ Study plan for this stage
Pace: 10–12 weeks total. Weeks 1–7: "Hands-On Machine Learning with Scikit-Learn, Keras, and TensorFlow" by Aurélien Géron — focus on Parts I & II (skip deep learning chapters for now), ~40–50 pages/day, 5 days/week. Weeks 8–12: "An Introduction to Statistical Learning" by Gareth James — ~30–40 pages/day,
- The ML project lifecycle: framing a problem, selecting a performance metric, and building an end-to-end pipeline (Géron Ch. 1–2)
- Supervised learning algorithms — Linear & Logistic Regression, SVMs, Decision Trees, Random Forests, and Gradient Boosting — their mechanics, assumptions, and scikit-learn APIs (Géron Ch. 3–7; ISL Ch. 3–8)
- Bias–variance tradeoff and model complexity: underfitting vs. overfitting, regularization (Ridge, Lasso, Elastic Net) (Géron Ch. 4; ISL Ch. 2, 6)
- Feature engineering and preprocessing pipelines: imputation, scaling, encoding, and scikit-learn's Pipeline & ColumnTransformer (Géron Ch. 2)
- Model evaluation and selection: cross-validation, confusion matrix, precision/recall/F1, ROC-AUC, and the importance of a proper train/validation/test split (Géron Ch. 3; ISL Ch. 5)
- Hyperparameter tuning strategies: GridSearchCV, RandomizedSearchCV, and the rationale behind each (Géron Ch. 2)
- Unsupervised learning fundamentals: K-Means clustering and Principal Component Analysis (PCA) for dimensionality reduction (Géron Ch. 8–9; ISL Ch. 10)
- Resampling methods — cross-validation and the bootstrap — as rigorous tools for estimating test error (ISL Ch. 5)
- Given a new supervised learning problem, how would you frame it (regression vs. classification?), choose an appropriate algorithm, and define a meaningful performance metric — walking through the checklist Géron outlines in Chapter 2?
- Explain the bias–variance tradeoff in your own words. How do Ridge and Lasso regression address it differently, and when would you prefer one over the other (as discussed in ISL Ch. 6)?
- What is k-fold cross-validation, why is it preferred over a single train/test split, and how does the bootstrap differ from it (ISL Ch. 5)?
- How does a Random Forest reduce variance compared to a single Decision Tree, and what role does feature randomness play — as described in both Géron Ch. 7 and ISL Ch. 8?
- Walk through the steps to build a full scikit-learn Pipeline — from raw data to a tuned model — including preprocessing, a chosen estimator, and a RandomizedSearchCV call (Géron Ch. 2)
- When should you use PCA before modeling, and what does 'explained variance ratio' tell you about how many components to retain (Géron Ch. 8; ISL Ch. 10)?
- End-to-end project (Géron Ch. 2 extended): Reproduce the California Housing notebook from scratch without copy-pasting — build a ColumnTransformer pipeline, train at least three algorithms (e.g., Linear Regression, Random Forest, Gradient Boosting), compare RMSE via 10-fold cross-validation, and tune the best model with RandomizedSearchCV.
- Algorithm from scratch: Implement Linear Regression with gradient descent and Logistic Regression with a sigmoid in pure NumPy, then verify your predictions match scikit-learn's output on the same dataset — reinforcing the theory from Géron Ch. 4 and ISL Ch. 3–4.
- Classification deep-dive (Géron Ch. 3): Train a multi-class classifier on the MNIST dataset; plot the full confusion matrix as a heatmap, compute per-class precision/recall/F1, and plot the ROC curve — then write a one-paragraph interpretation of each plot.
- ISL Lab replication in Python: Convert the R labs from ISL Ch. 6 (Ridge/Lasso) and Ch. 8 (Random Forests/Boosting) into Python using scikit-learn, reproducing the key coefficient-path and test-error plots to confirm your understanding of regularization and ensemble methods.
- Unsupervised exploration: Apply K-Means and PCA (Géron Ch. 8–9; ISL Ch. 10) to a real dataset (e.g., the Olivetti faces or a Kaggle tabular dataset) — use the elbow method and silhouette score to choose k, and visualize the first two principal components colored by cluster label.
- Bias–variance experiment: For a dataset of your choice, deliberately train models of increasing complexity (e.g., polynomial degree 1→10, or max_depth 1→20 in a Decision Tree); plot training error vs. validation error to visually locate the sweet spot, and annotate where underfitting and overfitting occur — connecting the plot directly to ISL Ch. 2's Figure 2.9.
Next up: Mastering scikit-learn pipelines, evaluation rigor, and classical ML algorithms here provides the mental model of "learnable parameters + loss minimization" that makes the transition to neural networks and deep learning frameworks — the natural next stage — feel like a principled extension rather than a leap into the unknown.
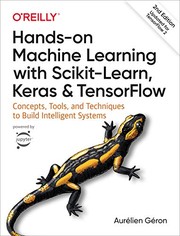
The most widely recommended practical ML book — it balances intuition, math, and code perfectly, covering the full pipeline from data prep to neural networks. It is the natural next step after mastering pandas.

Provides the rigorous statistical theory behind the algorithms encountered in the previous book, deepening understanding of model selection, regularization, and inference without requiring a math PhD.
Advanced Depth & Professional Craft
ExpertMaster deep learning, causal thinking, and the real-world engineering and decision-making skills needed to work as a professional data scientist.
▸ Study plan for this stage
Pace: 16–20 weeks total: ~6–7 weeks on "Deep Learning" (~25–30 pages/day, focusing on Parts II–III for theory and modern architectures); ~3–4 weeks on "The Book of Why" (~20–25 pages/day, reading carefully with reflection time for causal diagrams); ~5–6 weeks on "Designing Machine Learning Systems" (~20 p
- Deep neural network fundamentals: backpropagation, gradient descent variants, regularization (dropout, batch norm, weight decay), and optimization landscapes as covered in Goodfellow et al.
- Modern architectures from 'Deep Learning': CNNs, RNNs/LSTMs, autoencoders, generative models (VAEs, GANs), and the representational power of depth
- Probabilistic and Bayesian foundations of deep learning: maximum likelihood estimation, latent variable models, and approximate inference (Goodfellow Part III)
- The Ladder of Causation from Pearl: association vs. intervention vs. counterfactuals, and why standard ML is confined to the first rung
- Causal graphs, d-separation, do-calculus, and the backdoor/frontdoor criteria for identifying causal effects from observational data (The Book of Why)
- Counterfactual reasoning and its implications for fairness, explainability, and decision-making in ML systems
- ML system design lifecycle from Huyen: data engineering pipelines, feature stores, training/serving skew, model versioning, and deployment strategies (shadow mode, canary, A/B)
- Production reliability concerns: data distribution shifts (covariate, label, concept drift), monitoring, continual learning, and the human-in-the-loop feedback cycle (Designing Machine Learning Systems)
- From 'Deep Learning': How does backpropagation compute gradients efficiently via the chain rule, and what practical issues (vanishing/exploding gradients) arise in deep networks and how are they mitigated?
- From 'Deep Learning': What are the architectural motivations behind CNNs (parameter sharing, local connectivity) and LSTMs (gating mechanisms), and when would you choose one over the other?
- From 'The Book of Why': What is the fundamental difference between a conditional probability P(Y|X) and an interventional probability P(Y|do(X)), and why does this distinction matter for real-world decision-making?
- From 'The Book of Why': How do the backdoor and frontdoor criteria allow you to estimate causal effects from purely observational data, and what assumptions must hold?
- From 'Designing Machine Learning Systems': What are the key sources of training-serving skew, and what monitoring and retraining strategies does Huyen recommend to detect and correct them in production?
- Synthesizing all three books: How would you design an ML system that not only performs well on a held-out test set but also reasons causally about interventions and remains reliable under distribution shift in production?
- Implement a neural network from scratch in NumPy (forward pass, backprop, mini-batch SGD) using the mathematical framework in Goodfellow Chapters 6–8, then replicate it in PyTorch/TensorFlow to compare abstraction layers.
- Train a CNN on an image dataset and an LSTM on a sequence dataset; systematically ablate regularization techniques (dropout, batch norm) and log the effect on train/val loss curves, connecting observations to Goodfellow's theory.
- Build and train a simple VAE or GAN on a small dataset (e.g., MNIST or CelebA); write a one-page explanation of the objective function grounded in the probabilistic framework from Goodfellow Part III.
- Draw a causal DAG for a real-world scenario relevant to your domain (e.g., ad click-through, medical treatment, hiring), identify all backdoor paths, apply the backdoor criterion, and estimate the causal effect using a public observational dataset — directly applying Pearl's do-calculus.
- Conduct a 'counterfactual audit' of a trained classifier: use Pearl's counterfactual framework to ask 'would this prediction have changed if feature X had been different?' and document findings on at least one fairness-relevant attribute.
- Design a full ML system design document for a production use case (e.g., a recommendation system or fraud detector) following Huyen's framework: define the ML objective, data pipeline, feature store, training strategy, deployment approach (canary/shadow), and a monitoring plan with drift-detection thresholds.
Next up: By mastering deep learning theory, causal reasoning, and production system design across these three books, the reader has the full professional toolkit to move into specialized or leadership-level work — whether that means research (extending models), applied science (causal ML in industry), or ML engineering at scale — and is prepared to engage with cutting-edge literature, domain-specific appli
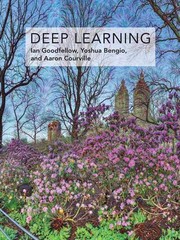
The canonical graduate-level reference for deep learning theory — covers neural network architectures, optimization, and regularization with mathematical rigor, building on the neural network intuition from Géron.

Introduces causal inference and the limits of purely correlational thinking — an essential perspective for any data scientist who wants to move from describing data to understanding and acting on it.

Covers the production engineering side of data science — data pipelines, model deployment, monitoring, and iteration — translating academic ML knowledge into real-world system design.
Discussion
Keep reading
Paths that share books, cover the same subject, or open a related topic.