Excel and spreadsheets: the best books to go from basics to power user
This curriculum takes a complete beginner from zero spreadsheet confidence to advanced Excel power-user across four carefully sequenced stages. Each stage builds on the last — first establishing core vocabulary and navigation, then mastering formulas and functions, then unlocking data analysis tools like PivotTables and charts, and finally automating work with data models and macros.
Foundations: Getting Comfortable with Excel
BeginnerNavigate the Excel interface confidently, enter and format data, write basic formulas, and understand how spreadsheets are structured.
▸ Study plan for this stage
Pace: 4–5 weeks, ~40–50 pages/day (Excel 2019 Bible: Parts 1–2, approximately 200 pages; Microsoft Excel 2016 Step by Step: Chapters 1–4, approximately 120 pages)
- Excel interface anatomy: ribbons, tabs, toolbars, formula bar, name box, and how to navigate menus efficiently
- Cell references and addressing: absolute vs. relative references, and how they behave when copied across rows and columns
- Data entry best practices: formatting cells (numbers, currency, dates), text alignment, and column/row sizing for readability
- Basic formula construction: syntax, operators (arithmetic, comparison, logical), and order of operations in Excel
- Built-in functions for everyday tasks: SUM, AVERAGE, COUNT, IF statements, and when to use each
- Spreadsheet structure and organization: worksheets, workbooks, naming conventions, and how to arrange data logically
- Copying, pasting, and moving data: understanding how formulas adjust and when to lock references with absolute addressing
- What is the difference between absolute and relative cell references, and how do you write each in a formula?
- How do you create a basic IF formula, and what are the three components it requires?
- Walk through the steps to format a column of numbers as currency with two decimal places.
- What is the difference between a worksheet and a workbook, and how do you navigate between multiple sheets?
- When you copy a formula containing =A1+B1 from row 1 to row 5, what does the formula become in row 5, and why?
- Name three common Excel functions (other than IF) and describe what each one does.
- Create a simple household budget spreadsheet: set up columns for income and expenses, enter sample data, and use SUM formulas to calculate totals and net income.
- Build a grade tracker for a fictional class: enter student names and test scores, calculate averages using AVERAGE, and use IF statements to assign letter grades (A/B/C/D/F) based on score ranges.
- Practice cell formatting: create a sample invoice with product names, quantities, unit prices, and totals; format prices as currency, align headers, and adjust column widths for clarity.
- Experiment with relative vs. absolute references: create a multiplication table (1–10 × 1–10) using formulas with mixed references, then copy formulas to verify they adjust correctly.
- Organize a personal project tracker: create multiple worksheets (one per project), use formulas to sum hours or costs across sheets, and practice navigating between sheets.
- Replicate a real-world scenario (e.g., sales data, inventory list, or expense report): enter raw data, apply formatting, write formulas to calculate subtotals/percentages, and format the final output for presentation.
Next up: Mastering these foundational skills—confident navigation, clean data entry, and reliable formulas—equips you to tackle intermediate topics like data analysis, pivot tables, and advanced functions in the next stage.

The definitive beginner-to-advanced reference for Excel; starting here gives you a complete mental map of the tool so nothing feels mysterious as you go deeper.

A hands-on, task-by-task walkthrough that reinforces the Bible's concepts with guided exercises — ideal for building muscle memory early on.
Formulas & Functions: The Engine of Excel
BeginnerWrite and combine core functions (VLOOKUP, IF, SUMIF, INDEX/MATCH, text and date functions) to answer real business questions with data.
▸ Study plan for this stage
Pace: 4–5 weeks, ~25–30 pages/day. Start with "Excel Formulas and Functions for Dummies" (weeks 1–3, ~60 pages/week), then transition to "Excel 2019 Power Programming with VBA" (weeks 4–5, focusing on VBA fundamentals that extend formula logic).
- Formula syntax and cell references (absolute vs. relative) as the foundation for reusable logic
- Nested IF statements and logical functions (AND, OR, NOT) to handle multi-condition business rules
- VLOOKUP and INDEX/MATCH for cross-referencing data across tables—the core lookup pattern in real business workflows
- SUMIF, COUNTIF, and AVERAGEIF to aggregate data conditionally—essential for reporting and analysis
- Text functions (CONCATENATE, LEFT, RIGHT, FIND, SUBSTITUTE) to clean and manipulate data for analysis
- Date functions (TODAY, DATE, DATEDIF, MONTH, YEAR) to calculate time-based metrics and aging reports
- Array formulas and formula combinations to solve complex multi-step business problems without helper columns
- VBA fundamentals as a bridge: how macros automate repetitive formula workflows and extend Excel's capabilities
- How do absolute ($) and relative cell references work, and when should you use each in a formula you plan to copy down or across?
- Write a nested IF statement that assigns a sales commission tier (e.g., 5%, 10%, 15%) based on quarterly revenue thresholds.
- Explain the difference between VLOOKUP and INDEX/MATCH. When would you choose INDEX/MATCH over VLOOKUP in a real business scenario?
- Create a SUMIF formula that totals sales for a specific region from a large dataset. How would you modify it to sum based on multiple criteria (SUMIFS)?
- How would you use text functions to extract a customer ID from an email address or standardize inconsistent product names?
- Write a formula using DATEDIF or date functions to calculate employee tenure in years and months from a hire date.
- What is an array formula, and how can it solve a problem that would otherwise require a helper column?
- Build a pricing lookup table and use VLOOKUP to populate unit prices for a sales order list. Then refactor it with INDEX/MATCH to handle non-sorted data.
- Create a commission calculator using nested IF statements that assigns tiers based on sales amount, then validate it against 5 test cases.
- Extract first and last names from a full-name column using LEFT, RIGHT, and FIND functions; concatenate them in reverse order.
- Build a monthly sales report using SUMIF to total revenue by region, COUNTIF to count transactions, and AVERAGEIF to calculate average order value.
- Calculate employee tenure (years and months) from hire dates using date functions; create an aging report that flags employees with >5 years tenure.
- Combine VLOOKUP with IF to flag inventory items that are both below reorder level AND from a specific supplier.
- Refactor a multi-step calculation (currently using 3+ helper columns) into a single array formula or INDEX/MATCH combination.
- Create a dynamic dashboard snippet: use SUMIFS to total sales by region AND quarter, with date functions to auto-filter the current year.
Next up: Mastering these core functions and understanding how formulas solve business problems prepares you to automate and scale these workflows with VBA macros, which will be the focus of the next stage.
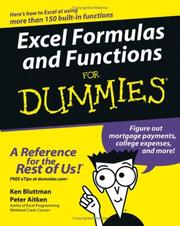
Bridges the gap between basic entry and real formula thinking; its plain-language explanations make function logic click before tackling more complex references.

Introduces the formula object model and named ranges in depth, laying the groundwork for dynamic, maintainable spreadsheets before you move into data analysis.
Data Analysis: PivotTables, Charts & Dashboards
IntermediateSummarize large datasets with PivotTables and PivotCharts, build clear visualizations, and assemble interactive dashboards that communicate insights at a glance.
▸ Study plan for this stage
Pace: 8–10 weeks, ~25–35 pages/day (mix of reading and hands-on practice). Weeks 1–3: PivotTables fundamentals. Weeks 4–5: Charts and visualization. Weeks 6–8: Dashboard design and assembly. Weeks 8–10: Integration project and refinement.
- PivotTable structure and mechanics: fields, rows, columns, values, and filters to reshape raw data without formulas
- Data source preparation: ensuring clean, properly formatted data before creating PivotTables
- PivotChart creation and customization: linking charts to PivotTable summaries and adjusting visual properties
- Chart types and selection: choosing the right chart (column, bar, line, pie, scatter) for different data stories
- Dashboard design principles: layout, color, typography, and interactivity to communicate insights clearly
- Slicers and timeline controls: enabling end-user filtering and dynamic exploration of dashboard data
- Data refresh and maintenance: keeping PivotTables and dashboards current as source data changes
- Interactive dashboard assembly: combining PivotTables, PivotCharts, and controls into cohesive, user-friendly reports
- What are the five main areas of a PivotTable (rows, columns, values, filters, data source), and how do you drag fields into each to reshape data?
- How do you prepare raw data for PivotTable analysis, and what common data quality issues prevent PivotTables from working correctly?
- What is the relationship between a PivotChart and a PivotTable, and how do changes to the PivotTable affect the linked chart?
- How do you select the appropriate chart type (column, bar, line, pie, scatter) based on the data story you want to tell?
- What are the core principles of dashboard design (layout, visual hierarchy, color, interactivity), and how do they improve insight communication?
- How do slicers and timeline controls enhance dashboard usability, and how do you configure them to filter multiple PivotTables simultaneously?
- Create a PivotTable from a messy sales dataset (50+ rows): drag product categories to rows, regions to columns, and revenue to values; add a date filter to explore trends by quarter.
- Build a PivotChart (column chart) from your PivotTable and modify its formatting (axis labels, legend, data labels) to make the story clear.
- Redesign the same dataset using three different chart types (column, line, pie) and write a one-sentence explanation of which chart best communicates the insight.
- Assemble a single-page dashboard with two PivotTables and two PivotCharts, using slicers to allow filtering by region and product category across all four objects.
- Create a timeline control linked to a PivotTable with date data; practice filtering by month and year ranges to explore temporal patterns.
- Build a multi-sheet dashboard workbook: one sheet for raw data, one for PivotTables, one for charts, and one for the final dashboard layout; document your design choices.
Next up: Mastering PivotTables, charts, and dashboards equips you to summarize and present data visually; the next stage will deepen your ability to automate these processes and integrate them with advanced formulas, macros, and external data sources for enterprise-scale reporting.
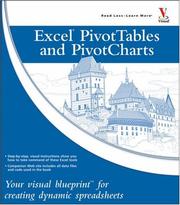
Focuses exclusively on PivotTables and PivotCharts with progressive examples — reading this after mastering formulas means you immediately see how the two layers connect.

The canonical deep-dive on Excel charting by one of the field's most trusted authors; teaches design principles alongside technical execution so your visuals are both accurate and compelling.

Ties PivotTables and charts together into real-world dashboard projects, teaching layout, interactivity, and storytelling with data — the capstone of the analysis stage.
Power Tools: Data Models, Power Query & Automation
ExpertImport and transform data with Power Query, build multi-table data models with Power Pivot, write DAX measures, and automate repetitive tasks with macros and VBA.
▸ Study plan for this stage
Pace: 8–10 weeks, ~40–50 pages/day with daily coding practice
- VBA fundamentals: objects, properties, methods, and the object model hierarchy
- Writing and debugging VBA code in the Visual Basic Editor (VBE)
- Working with ranges, worksheets, and workbooks programmatically
- Control structures: loops, conditionals, and error handling in VBA
- Creating user-defined functions (UDFs) and subroutines to automate tasks
- Recording, editing, and running macros for repetitive Excel operations
- Integrating VBA with Excel's built-in features to extend functionality
- Best practices for writing maintainable, efficient VBA code
- What is the Excel object model, and how do you navigate it to access ranges, worksheets, and workbooks in VBA?
- How do you record a macro, and what are the limitations of recorded code that require manual editing?
- What is the difference between a subroutine (Sub) and a function (Function) in VBA, and when would you use each?
- How do you use loops and conditionals to process data across multiple cells or rows efficiently?
- What are common error-handling techniques in VBA, and how do you implement them to make your code robust?
- How can you create custom user-defined functions (UDFs) in VBA and use them in Excel formulas?
- Record a simple macro that formats a range of cells, then edit the recorded code to make it more flexible and reusable
- Write a VBA subroutine that loops through a column of data, identifies cells meeting a condition, and applies formatting or calculations
- Create a user-defined function (UDF) that performs a custom calculation not available in standard Excel functions, then use it in a worksheet formula
- Build a macro that imports data from another workbook, cleans it (removes duplicates, trims whitespace), and places it in the current sheet
- Write error-handling code that gracefully manages missing files, empty ranges, or invalid user input
- Develop a macro that automates a multi-step workflow (e.g., open file → filter data → create summary → save with timestamp)
Next up: Mastering VBA automation in this stage equips you to build intelligent, self-updating spreadsheets that can be extended further with Power Query for advanced data transformation and Power Pivot for complex multi-table analytics in subsequent stages.
The go-to guide for Power Query (Get & Transform); reading it first in this stage gives you clean, reliable data before you model or automate anything.
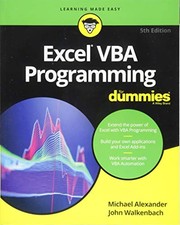
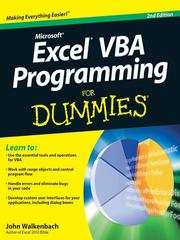
The most accessible entry point into VBA macros; placed last so you automate workflows you already understand deeply, making the code immediately purposeful and easier to retain.
Discussion
Keep reading
Paths that share books, cover the same subject, or open a related topic.