Best Books to Learn Business Analytics (in Order)
This curriculum builds a rigorous, end-to-end mastery of business analytics starting from an intermediate level. It moves from establishing the right metrics mindset and data-driven decision-making culture, through hands-on dashboard design and communication, to advanced competitive strategy powered by analytics — each stage deepening both the conceptual and practical toolkit.
Metrics That Matter
IntermediateIdentify, define, and prioritize the right business metrics — understanding what to measure, why it matters, and how to avoid vanity metrics that mislead decisions.
▸ Study plan for this stage
Pace: 6–7 weeks, ~40–50 pages/day (accounting for dense, concept-heavy material and reflection time)
- The One Metric That Matters (OMTM) framework: identifying the single most critical metric for your business stage and ruthlessly deprioritizing vanity metrics
- Actionable vs. vanity metrics: understanding the difference between metrics that drive decisions and those that merely inflate ego
- Metric selection by business model: how SaaS, e-commerce, mobile, and marketplace businesses require fundamentally different measurement approaches
- The measurement problem: recognizing what seems unmeasurable and applying systematic approaches to quantify intangibles using Hubbard's calibrated estimation techniques
- Baseline, trend, and comparative analysis: establishing what 'good' looks like and detecting meaningful change signals in noisy data
- Cohort analysis and segmentation: moving beyond aggregate metrics to understand behavior patterns across user groups and time periods
- The cost of measurement: balancing the value of perfect data against the time and resources required to collect it
- What is the One Metric That Matters (OMTM) for a given business, and how would you identify it for a company at a specific stage (early traction, scaling, optimization)?
- How do you distinguish between a vanity metric and an actionable metric, and why do teams often optimize for the wrong ones?
- What measurement approach would you use to quantify something seemingly intangible (e.g., customer satisfaction, brand awareness), and how does Hubbard's framework help?
- How should metric priorities shift as a business moves from early stage to growth to maturity, and what metrics should you stop tracking?
- What does a well-designed dashboard or reporting system look like for a specific business model, and what metrics would you exclude?
- How do you detect whether a metric change is meaningful signal or random noise, and what sample size or time period do you need?
- Audit a real company's public metrics (from earnings calls, investor decks, or marketing): identify which are vanity metrics vs. actionable, and propose what their OMTM should be at their current stage
- Design a measurement framework for a hypothetical startup in a given vertical (SaaS, e-commerce, mobile app): define 3–5 metrics, explain why each matters, and specify how you'd track them
- Apply Hubbard's calibrated estimation technique to estimate an 'unmeasurable' quantity (e.g., churn rate for a product you use, customer lifetime value for a local business): document your assumptions and refine estimates
- Build a cohort analysis for a sample dataset (provided or sourced): segment users by acquisition month/channel and track retention, revenue, or engagement over time to spot trends
- Create a one-page metric definition document for a business metric: include the formula, data source, refresh cadence, owner, and decision rules (e.g., 'if metric drops below X, we escalate')
- Critique a company's dashboard or KPI report: identify missing metrics, vanity metrics to remove, and propose a redesigned set aligned to business stage and strategy
Next up: This stage equips you to measure what matters; the next stage will teach you how to act on those measurements through experimentation, A/B testing, and data-driven decision-making frameworks.
Provides a practical, stage-by-stage framework for choosing the One Metric That Matters at any point in a business lifecycle — the perfect starting point for building a disciplined metrics vocabulary.
Challenges the myth that intangibles can't be measured and equips the reader with rigorous techniques for quantifying business uncertainty — essential before moving into data-driven decision-making.
Data-Driven Decision Making
IntermediateBuild a structured process for turning data into sound business decisions, including handling uncertainty, avoiding cognitive biases, and applying analytical reasoning in organizational contexts.
▸ Study plan for this stage
Pace: 12–14 weeks, ~40–50 pages/day (approximately 3 weeks per book with overlap for integration)
- System 1 vs. System 2 thinking: recognizing automatic intuitive judgments versus deliberate analytical reasoning
- Cognitive biases and heuristics: anchoring, availability bias, overconfidence, and how they distort business decisions
- Statistical literacy fundamentals: distributions, correlation vs. causation, probability, and sampling variability
- Uncertainty quantification: confidence intervals, margins of error, and communicating statistical uncertainty to stakeholders
- Data quality and context: understanding data sources, limitations, and the importance of asking the right questions before analysis
- The decision-making pipeline: translating raw data into actionable insights through structured analytical reasoning
- Organizational implementation: embedding data-driven culture, managing stakeholder expectations, and avoiding misinterpretation of results
- What are the key differences between System 1 and System 2 thinking, and how do they influence business decision-making?
- Name five cognitive biases discussed in Kahneman's work and explain how each one could lead to poor business decisions.
- Why is the distinction between correlation and causation critical in data analysis, and what are common pitfalls when interpreting statistical relationships?
- How should you communicate statistical uncertainty (confidence intervals, margins of error) to non-technical stakeholders in a business setting?
- What steps should you take to assess data quality and context before drawing conclusions from an analysis?
- Describe the end-to-end process of turning raw data into a business decision, including where cognitive biases and statistical reasoning intersect.
- Bias audit: Identify a recent business decision you or your organization made. Map it against Kahneman's cognitive biases—which ones likely influenced the outcome? Write a 1–2 page reflection.
- Statistical reinterpretation: Take a business claim or headline (e.g., 'Product X increases productivity by 40%'). Critique it using concepts from Wheelan—what's missing? What questions would you ask about sample size, confidence intervals, or causation?
- Data quality checklist: Select a dataset from your organization or a public source. Create a checklist of questions about its provenance, limitations, and context (inspired by Patil's emphasis on data quality). Document your findings.
- Decision memo with uncertainty: Write a 2–3 page business recommendation based on a small dataset or case study. Explicitly quantify uncertainty, explain your confidence level, and discuss alternative interpretations.
- Stakeholder communication exercise: Present a statistical finding (real or hypothetical) to a non-technical audience. Record yourself or practice with a peer. Did you avoid jargon? Did you clearly convey uncertainty without hedging the key insight?
- System 1 vs. System 2 journal: Over 2 weeks, log 3–5 business decisions you observe (your own or others'). For each, identify whether System 1 or System 2 dominated, what biases may have been at play, and what a more deliberate analytical approach would have looked like.
Next up: This stage equips you with the cognitive and statistical foundations to recognize flawed reasoning and uncertainty; the next stage will teach you the technical tools and methods to systematically extract insights from data and validate hypotheses at scale.
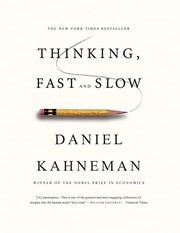
Exposes the cognitive biases that undermine data interpretation — reading this first ensures the analytical frameworks that follow are applied with the right critical mindset.
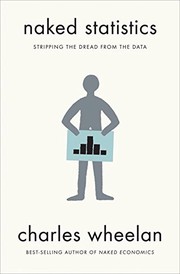
Demystifies the statistical concepts (regression, inference, correlation) that underpin virtually every business analytics tool, bridging intuition and rigor without requiring a math background.

A concise, practitioner-focused guide on building data-driven cultures and teams inside real organizations — translates the prior conceptual groundwork into organizational action.
Dashboards & Data Communication
IntermediateDesign clear, effective dashboards and data visualizations that communicate insights to both technical and non-technical stakeholders and drive action.
▸ Study plan for this stage
Pace: 8–10 weeks, ~25–30 pages/day, with 1–2 weeks per book plus integration time
- The importance of context and audience understanding in data visualization—knowing your audience's needs, constraints, and decision-making process shapes every design choice
- Pre-attentive processing and visual encoding—leveraging how the human eye processes information in milliseconds (position, color, size) to make data instantly readable
- Eliminating clutter and cognitive load—removing non-data ink, simplifying charts, and focusing on the message rather than decorative elements
- Narrative structure in data storytelling—using data to build a compelling story with a clear beginning, middle, and end that drives action
- Dashboard design principles—balancing information density, interactivity, and usability to create tools that support real-time decision-making
- Choosing the right visualization type for your data and message—matching chart types to data relationships and analytical goals
- Color theory and accessibility in visualization—using color strategically and responsibly to highlight, encode, and ensure clarity for all viewers
- Iterative design and testing—refining visualizations through feedback and validation to ensure they communicate effectively
- How do you determine the right audience and context for a visualization, and why does this matter before you even sketch a chart?
- What is pre-attentive processing, and how can you use it to make your data visualizations more effective?
- What is the difference between a dashboard and a static report, and when should you use each?
- How do you structure a data story to move an audience from awareness to action?
- What are the key principles for eliminating clutter in dashboards, and what is 'non-data ink'?
- How do color, size, and position work together to encode data, and what are common pitfalls to avoid?
- Critique exercise: Find 3 real-world dashboards (from business software, news sites, or public data sources) and identify what works and what doesn't using Knaflic's and Few's principles; write a 1-page analysis for each
- Redesign project: Take a poorly designed chart or dashboard you find online or create a messy one intentionally, then redesign it using pre-attentive processing and clutter-elimination techniques; document your reasoning
- Audience analysis: Choose a business scenario (e.g., 'sales performance for executives' vs. 'sales performance for regional managers') and design two different visualizations for the same dataset tailored to each audience
- Story structure exercise: Write a 3–5 minute data story outline (with a clear hook, rising action, and call-to-action) for a dataset of your choice, then create 3–4 supporting visualizations
- Dashboard prototype: Design a functional dashboard mockup (on paper, in PowerPoint, or using a tool like Figma) for a specific business use case; include at least 4–5 visualizations and explain your layout and interaction choices
- Color and accessibility audit: Create a visualization using color to encode data, then test it with a color-blindness simulator; iterate to ensure clarity for all viewers
Next up: This stage equips you with the principles and tools to communicate data insights clearly and persuasively; the next stage will likely deepen your ability to build interactive, scalable dashboards and explore advanced analytics techniques that feed into those visualizations.
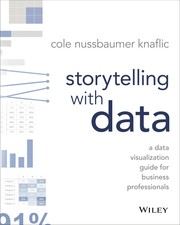
The canonical guide to data visualization best practices — teaches how to eliminate clutter, choose the right chart, and craft a narrative around data before building any dashboard.

The definitive reference on dashboard design principles, covering layout, visual encoding, and performance monitoring — read after Knaflic to apply storytelling principles at the dashboard level.
Competing on Analytics
ExpertUnderstand how world-class organizations embed analytics into strategy and operations to build sustainable competitive advantage, and learn how to lead that transformation.
▸ Study plan for this stage
Pace: 8–10 weeks, ~40–50 pages/day. Allocate roughly 3 weeks to "Competing on Analytics" (450 pages), 2–3 weeks to "Prediction Machines" (350 pages), and 3–4 weeks to "The Analytics Edge" (500 pages), with 1 week for integration and review.
- The analytics value chain: how to identify, capture, and operationalize data-driven insights across the organization
- Building an analytics capability: organizational structure, talent, technology, and governance required to sustain competitive advantage
- The economics of prediction: how machine learning and AI shift the cost of prediction and create new business opportunities
- From prediction to decision: translating algorithmic outputs into actionable business decisions and embedding them into operations
- Change management and leadership: overcoming organizational resistance, aligning incentives, and fostering a data-driven culture
- Real-world case studies: how leading companies (Amazon, Google, UPS, Netflix, etc.) embed analytics into strategy and execution
- Ethical and practical constraints: understanding model limitations, bias, interpretability, and responsible deployment of analytics
- What are the key stages of the analytics value chain, and how do organizations move from data collection to sustained competitive advantage?
- How has machine learning changed the economics of prediction, and what new business models does this enable?
- What organizational structures, skills, and governance mechanisms are required to build a world-class analytics capability?
- How do you translate predictive models and analytical insights into operational decisions and embed them into business processes?
- What are the main barriers to analytics adoption in organizations, and what leadership practices overcome them?
- How do you evaluate whether an analytics initiative is creating genuine business value, and how do you scale successful pilots?
- Map the analytics value chain for your own organization or a case study company: identify where data originates, how it flows, where insights are generated, and where decisions are made. Identify bottlenecks.
- Design an analytics capability roadmap for a specific business problem (e.g., customer churn, supply chain optimization). Define required talent, technology, data sources, and governance.
- Build a simple predictive model (using provided datasets or public data) on a business problem, then write a memo translating the model's output into a specific operational decision and implementation plan.
- Conduct a competitive analysis: identify how 2–3 leading companies in an industry use analytics to compete. Document their data sources, analytical methods, and business impact.
- Role-play a change management scenario: develop a communication and incentive plan to convince a skeptical business unit to adopt a new analytics-driven process.
- Critique a real analytics project (from case studies in the books or your own experience): assess what worked, what failed, and what organizational or technical factors determined success.
Next up: This stage equips you to recognize analytics as a strategic asset and lead its integration into business strategy; the next stage will likely deepen your ability to design, implement, and scale specific analytical methods and systems in complex, real-world environments.

The landmark book that defined analytics as a strategic weapon — synthesizes everything learned so far into a framework for how companies win by making analytics a core competency.

Reframes AI and advanced analytics as a dramatic reduction in the cost of prediction, giving leaders a clear economic lens for where to invest analytically for maximum strategic impact.

Bridges strategy and execution with rigorous, real-world case studies showing how optimization and predictive models deliver measurable business edges — the capstone of the entire curriculum.
Discussion
Keep reading
Paths that share books, cover the same subject, or open a related topic.