Bond Investing: Best Books on Fixed Income and Building Bond Portfolios
This curriculum builds a rigorous, practitioner-level mastery of bond investing and fixed income, starting from intermediate foundations and progressing through the mechanics of yields and duration, credit risk analysis, and finally portfolio construction and risk management. Each stage sharpens the tools needed for the next, so that by the end the reader can confidently analyze, price, and build resilient fixed-income portfolios.
Foundations & Core Mechanics
BeginnerEstablish a solid working vocabulary of bond markets — price/yield relationships, duration, convexity, and the basic taxonomy of fixed-income instruments — so every later concept has a firm anchor.
▸ Study plan for this stage
Pace: 4–5 weeks, ~40–50 pages/day. Start with "The Bond Book" (Chapters 1–8, approximately 2.5 weeks), then move to "Bonds" by Richelson (Chapters 1–6, approximately 2 weeks) to deepen and reinforce mechanics.
- Bond pricing mechanics: the inverse relationship between price and yield, and why it exists mathematically
- Yield measures: current yield, yield-to-maturity (YTM), and when each is appropriate to use
- Duration and modified duration: how to interpret them as a bond's interest-rate sensitivity and average time to cash recovery
- Convexity: why duration alone is incomplete, and how convexity explains price behavior in large yield moves
- Bond taxonomy: understanding coupon bonds, zero-coupon bonds, callable bonds, and how structure affects risk
- Credit risk vs. interest-rate risk: distinguishing default probability from market price volatility
- The yield curve: what it represents, how to read it, and why its shape matters for bond selection
- Bond valuation as present value: the foundational formula and how to apply it to different bond types
- Why does a bond's price fall when interest rates rise? Walk through the mechanism with a concrete example.
- What is the difference between current yield and yield-to-maturity, and when would you use each metric?
- How would you explain duration to someone who has never invested in bonds? What does it actually measure?
- A bond has positive convexity. What does this mean for its price behavior when yields move sharply up or down?
- Compare a 10-year callable bond to a 10-year straight bond with the same coupon. Why would the callable bond trade at a lower price?
- Given a flat yield curve, why might you still prefer a 5-year bond over a 10-year bond? What risks are you considering?
- Using a bond calculator or spreadsheet, build a simple price-yield table for a 5-year, 4% coupon bond. Plot the curve and verify the inverse relationship holds across a range of yields (2%–8%).
- Take three real bonds (e.g., a Treasury, a corporate, a high-yield bond) and calculate or look up their duration and convexity. Rank them by interest-rate sensitivity and explain why.
- Work through Thau's examples of YTM calculation by hand for at least two bonds—one at par, one at a discount, one at a premium—to internalize the iterative nature of the calculation.
- Construct a simple zero-coupon bond scenario: if you buy a 10-year zero at a 3% yield, what is its price? If yields rise to 4%, what is the new price? Calculate the percentage loss and compare it to a 10-year coupon bond's loss under the same move.
- Sketch or find a real yield curve (Treasury curve from the last 5 years). Identify whether it is steep, flat, or inverted, and write a one-paragraph explanation of what that shape might imply about economic expectations.
- Compare the prospectus or term sheet of a callable bond and a straight bond. Identify the call provision, estimate the embedded option value, and explain why the callable bond's yield is higher.
Next up: This foundation in price mechanics, duration, and bond taxonomy equips you to move into portfolio construction and strategy—you will now be able to understand how to select bonds to meet specific return and risk objectives, and how to manage a portfolio's overall interest-rate sensitivity.
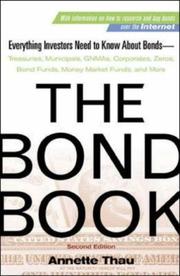
The single best plain-English primer on how bonds work, covering Treasuries, munis, corporates, and mortgage-backed securities. Reading this first ensures you have the vocabulary and intuition every subsequent book assumes.
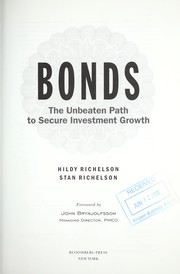
Complements Thau by focusing on individual bond laddering and income strategies, reinforcing yield and maturity concepts through a practical, investor-first lens before moving into more quantitative territory.
Yield Curves, Duration & Pricing Mechanics
IntermediateDevelop quantitative fluency in yield-curve dynamics, duration, convexity, and bond math so you can price bonds, measure interest-rate sensitivity, and understand how central bank policy transmits to fixed-income markets.
▸ Study plan for this stage
Pace: 8–10 weeks, ~40–50 pages/day, with 2–3 dedicated math-practice days per week
- Yield curve construction, shape, and interpretation (normal, flat, inverted curves and what they signal about monetary policy and growth expectations)
- Duration and modified duration as measures of bond price sensitivity to yield changes, and why duration matters more than maturity alone
- Convexity and its role in explaining the non-linear relationship between bond prices and yields, especially for large yield moves
- Bond pricing mechanics: present value of cash flows, yield-to-maturity (YTM) calculation, and the inverse relationship between price and yield
- Key rate duration and partial duration for understanding how different points on the yield curve affect specific bonds
- Effective duration for bonds with embedded options (callable, putable) and how optionality changes price sensitivity
- Spread duration and credit spread risk as distinct from interest-rate duration
- Central bank policy transmission: how Fed actions reshape the yield curve and cascade through fixed-income markets
- How do you construct a yield curve from market prices, and what does the shape of the curve tell you about economic expectations and monetary policy?
- Why is duration a better measure of interest-rate risk than maturity, and how do you calculate modified duration from Macaulay duration?
- What is convexity, why does it matter for large yield moves, and how do you interpret positive vs. negative convexity in the context of callable bonds?
- Walk through the full calculation of a bond's price given its coupon, maturity, and yield-to-maturity; then show how price changes when yields move 50 basis points.
- How does key rate duration differ from effective duration, and when would you use each measure to assess portfolio risk?
- How do central bank policy changes (e.g., Fed rate hikes or quantitative easing) transmit through the yield curve, and what does this imply for bond valuations?
- Reconstruct a real yield curve (e.g., US Treasury curve from a given date) using bond prices and cash flows; plot it and describe its shape in terms of economic signals.
- Calculate YTM, Macaulay duration, and modified duration for a 10-year corporate bond by hand; verify your results with a financial calculator or spreadsheet.
- Build a bond pricing spreadsheet that computes price for any coupon, maturity, and yield; then stress-test it by shifting yields ±100 bps and observe price changes.
- Compute duration and convexity for two bonds (e.g., a 5-year and a 30-year Treasury); compare their price sensitivity and explain why convexity matters for the longer bond.
- Analyze a callable bond: calculate its effective duration and compare it to a non-callable bond of similar maturity; discuss why the callable bond's duration is lower and more volatile.
- Track a recent Fed policy announcement and trace its impact on the yield curve over the following week; calculate how key rate durations would have affected a sample bond portfolio.
Next up: This stage equips you with the quantitative toolkit to measure and predict fixed-income price movements, setting the foundation for analyzing credit risk, sector rotation, and portfolio construction strategies in the next stage.

The foundational text that introduced modern bond math and yield analysis to practitioners. Reading it here bridges intuition from Stage 1 to rigorous quantitative thinking about yield and duration.
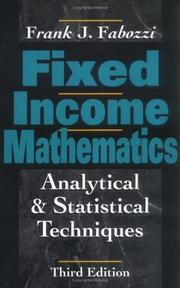
Fabozzi's concise workbook drills the calculations behind price, yield, duration, and convexity — essential before tackling his more comprehensive handbook or advanced portfolio texts.
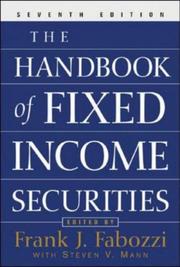
The industry-standard reference covering every major fixed-income sector and analytical framework. Read after the math primer so you can engage with its technical depth across MBS, ABS, and derivatives chapters.
Credit Risk & Spread Analysis
IntermediateMaster credit analysis — how to assess default risk, interpret credit spreads, read corporate balance sheets for bond investors, and understand the credit cycle — so you can evaluate any non-government bond on its merits.
▸ Study plan for this stage
Pace: 8–10 weeks, ~40–50 pages/day (mix of dense technical material and case studies; allow extra time for credit metrics practice)
- Credit risk measurement frameworks: probability of default (PD), loss given default (LGD), and exposure at default (EAD) as the foundation for bond valuation
- Credit spread decomposition: understanding how spreads compensate for default risk, liquidity risk, and other factors
- Corporate balance sheet analysis for bond investors: leverage ratios, interest coverage, cash flow metrics, and working capital trends that signal credit quality
- Credit rating methodologies: how agencies assess creditworthiness and the relationship between ratings and actual default probabilities
- High-yield bond characteristics: structural features (covenants, seniority, callability) and how they affect risk and return
- Credit cycle dynamics: how economic conditions, industry trends, and capital structure changes drive credit spreads and default risk over time
- Relative value in credit: comparing bonds across issuers, sectors, and rating categories using spread-adjusted metrics
- Distressed debt signals: recognizing warning signs of deteriorating credit quality before ratings downgrades occur
- How do probability of default, loss given default, and exposure at default combine to determine expected loss, and why does each component matter for bond pricing?
- What are the main components of a credit spread, and how would you decompose a 300 basis point spread into its constituent risk premiums?
- Walk through a corporate balance sheet and identify the three most critical metrics a bond investor should monitor—and explain what each tells you about credit risk.
- How do high-yield bond covenants (financial maintenance, incurrence-based, change of control) protect creditors, and why do weaker covenants increase spread requirements?
- Describe the relationship between the credit cycle and credit spreads: why do spreads widen in recessions and tighten in expansions, and how can you position ahead of these moves?
- Given two bonds in the same industry with similar ratings but different leverage ratios and interest coverage, how would you determine which offers better relative value?
- Extract and calculate leverage (Net Debt/EBITDA), interest coverage (EBITDA/Interest Expense), and free cash flow metrics from three corporate 10-K filings; compare trends year-over-year and assess credit trajectory
- Build a simple credit risk model using Saunders' PD/LGD/EAD framework: assign estimated default probabilities and recovery rates to 5 corporate bonds, calculate expected loss, and compare to market spreads
- Analyze a high-yield bond prospectus: map out all covenants, identify which are maintenance-based vs. incurrence-based, and assess how restrictive they are relative to peers in the same sector
- Decompose the spread of a 5-year corporate bond into its components (default risk premium, liquidity premium, option-adjusted spread) using Bloomberg or similar tools; explain what each tells you
- Track credit spreads for a single issuer or sector over 6–12 months; correlate spread movements to earnings releases, leverage changes, and macro events; document what you learn about credit cycle sensitivity
- Compare two bonds from the same issuer with different seniority levels (senior secured vs. senior unsecured); calculate the implied recovery rate difference and assess whether the spread differential compensates you for the additional risk
Next up: This stage equips you with the analytical toolkit to assess credit risk independently; the next stage will teach you how to construct a diversified fixed-income portfolio and manage credit risk across multiple positions using hedging and duration strategies.

Provides a rigorous conceptual framework for measuring and pricing credit risk, including structural and reduced-form models, giving you the analytical language used by institutional credit analysts.
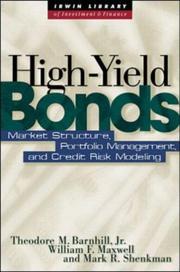
Focuses on the high-yield (junk bond) market where credit risk dominates price behavior — mastering this extreme end of the credit spectrum sharpens your instincts for investment-grade credit analysis as well.
Portfolio Construction & Risk Management
ExpertSynthesize everything into a coherent portfolio framework — how to combine bonds across sectors and maturities, manage duration and credit exposure, hedge risks, and build a portfolio resilient to rate shocks and credit events.
▸ Study plan for this stage
Pace: 8–10 weeks, ~40–50 pages/day (mix of dense technical content and strategic framework material)
- Portfolio duration management: matching duration to liabilities, immunization strategies, and rebalancing to control interest rate risk
- Credit exposure and diversification: sector allocation, credit quality laddering, concentration limits, and correlation dynamics across bond types
- Yield curve positioning: understanding term structure, barbell vs. bullet strategies, and tactical curve positioning within a strategic framework
- Risk-adjusted return optimization: using duration, convexity, and credit spread analysis to construct efficient portfolios that balance yield with downside protection
- Hedging techniques: interest rate derivatives, credit default swaps, and other tools to manage tail risks and rate shock scenarios
- Behavioral and structural portfolio principles: evidence-based bond allocation, rebalancing discipline, cost minimization, and avoiding common pitfalls
- Stress testing and scenario analysis: modeling portfolio behavior under rate shocks, credit events, and market dislocations
- Integration of bonds into multi-asset portfolios: role of fixed income in overall asset allocation and correlation with equities
- How do you construct a bond portfolio with a target duration, and what rebalancing discipline maintains that duration as rates and credit spreads change?
- What are the trade-offs between barbell, bullet, and ladder strategies, and when is each appropriate given market conditions and investor constraints?
- How should you diversify across sectors, credit qualities, and maturities to manage concentration risk while maintaining yield?
- What role do convexity and negative convexity play in portfolio construction, and how do they affect returns in different rate scenarios?
- How can you use hedging instruments (futures, swaps, CDS) to manage duration and credit risk without abandoning the core portfolio thesis?
- What does evidence-based bond investing tell us about fees, active management, and rebalancing, and how should these insights shape portfolio construction?
- Build a sample bond portfolio (10–15 positions) across sectors and maturities with a target duration of 5–7 years; calculate and document the portfolio's duration, convexity, yield, and credit quality distribution
- Conduct a duration immunization exercise: given a liability (e.g., a $1M payment due in 5 years), construct a bond portfolio that immunizes against parallel rate shifts and test rebalancing frequency
- Perform a rate shock stress test on your portfolio: model returns if rates rise 100 bps, 200 bps, or fall 100 bps; compare outcomes across barbell, bullet, and ladder structures
- Analyze sector and credit quality allocation: use historical data to model correlation and volatility across sectors (Treasuries, corporates, municipals, securitized); optimize allocation to maximize risk-adjusted return
- Design a hedging strategy: identify a key portfolio risk (e.g., duration extension or credit spread widening) and propose a hedge using Treasury futures, interest rate swaps, or CDS; calculate the hedge ratio and cost
- Conduct a rebalancing simulation: track a portfolio over 12 months with quarterly rebalancing; measure the impact of rebalancing frequency, transaction costs, and tax drag on returns relative to a buy-and-hold approach
Next up: This stage equips you with the technical and strategic tools to construct and manage a resilient fixed income portfolio; the next stage will likely focus on implementation in real-world contexts—navigating market cycles, adapting to changing macro conditions, and integrating bond portfolios with broader wealth management and institutional mandates.
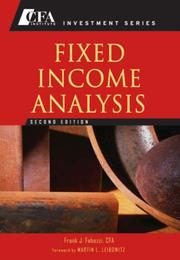
The CFA Institute's practitioner curriculum text ties together yield-curve strategies, liability-driven investing, and sector allocation into a unified portfolio framework — the natural capstone of the quantitative stages.
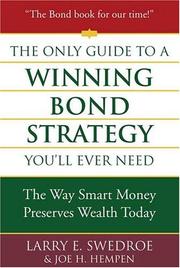
Grounds the advanced portfolio theory in evidence-based, real-world decision-making — a valuable final read that challenges you to apply everything learned with discipline and behavioral awareness.
Discussion
Keep reading
Paths that share books, cover the same subject, or open a related topic.