Best Books on Survey Methodology and Sampling Design
A survey is two separate problems wearing one name: choosing who to ask, which is statistics, and working out what an answer means, which is cognitive psychology. Most books do one well and the other badly, so this path deliberately alternates between them. It starts with what a poll can and cannot tell you, then questionnaire design and the psychology of answering, then sampling design from the practical to the theoretical, and ends with total survey error and the analysis of data from a complex design. The statistics stages assume comfort with probability, expectation and variance; the questionnaire stages assume nothing.
What a survey can and cannot tell you
BeginnerRead a published poll critically — margin of error, house effects, question wording, who was excluded — and understand the shape of the whole enterprise before learning any of its machinery.
▸ Study plan for this stage
Pace: Two to three weeks for 391 pages, and this is the one stage on the path you can read at ordinary trade-paperback speed. Asher's 222 pages are written for citizens rather than statisticians and go at 30-40 pages an evening; read it first and read it fast, because its job is to make vivid the failures
- The difference between sampling error and every other error a survey commits
- What a margin of error does and does not cover, and why it is silent about nonresponse and question wording
- House effects, and why two honest pollsters using different methods get different numbers
- Coverage: who was never in the frame at all, as distinct from who declined
- Weighting, and the fact that a published figure is almost never a raw tally
- The four things a survey does — sample, contact, ask, and process — and the fact that each has its own failure mode
- Why does a stated margin of error of three points understate the real uncertainty in almost every published poll?
- What is coverage error, and how does it differ from nonresponse error in both cause and remedy?
- How can two polls fielded the same week on the same population legitimately differ by six points?
- What would you need to know about a published poll, beyond its topline, before quoting it?
- Which parts of Fowler's process are statistical problems and which are psychological ones?
- Take a poll reported in the news this week, find its methodology statement, and list every question Asher would want answered that the statement does not answer
- Write out Fowler's survey process as a single-page diagram from memory after reading him, then check it against his table of contents and note what you dropped
- Find two polls on the same question with different results and work out, from their published methods, which differences in mode, frame or wording could account for the gap
- Pick a population you care about — renters in your city, say — and write down who would be missing from a landline frame, an online panel, and an address-based sample respectively
Next up: Asher and Fowler both keep saying that wording changes the answer without showing you why; the next stage is the psychology and the craft that explain it.

The best short book on how to be a sceptical consumer of survey results, written for citizens rather than statisticians. It is where to start because it makes vivid what everything later in the path is trying to prevent.
The compact practical overview of the whole process — sampling, mode, questions, interviewers, ethics — in roughly 180 pages. Read it end to end for the map. Our record is an early edition of a book now in its fifth; the structure is stable but buy current, since the mode chapters have been rewritten around online surveys.
Asking the question
IntermediateWrite and test a questionnaire: understand how respondents comprehend, retrieve, judge and edit their answers, and why the mode you use changes the answer you get.
▸ Study plan for this stage
Pace: Two to three months for 1,553 pages, but the four books are used in three different ways and should not be read at one rate. Fowler's Improving survey questions is 191 pages, practical and immediately usable, and reads in a week at 30 pages a sitting — start here. Bradburn, Sudman and Wansink's Aski
- The four-stage response model — comprehension, retrieval, judgement, response — that Tourangeau, Rips and Rasinski organise the field around
- Satisficing: the respondent doing the least work that will pass, and the design features that invite it
- Acquiescence, social desirability and recency and primacy effects, and which mode amplifies which
- Question order effects, including assimilation and contrast between adjacent items
- Open versus closed questions, and what a closed list forecloses
- Cognitive interviewing and field pretesting as the empirical test of a question
- The tailored design method: layout, visual language and the fact that a questionnaire is a document as well as an instrument
- Mode effects, and how to run a mixed-mode survey without the mode becoming a variable
- Walk a difficult autobiographical question through all four of Tourangeau, Rips and Rasinski's stages — where is it most likely to fail?
- Why do sensitive questions get more honest answers in a self-administered mode than in an interview, and what does that cost you elsewhere?
- What is satisficing, and name three concrete design choices that make it more likely?
- How does the visual layout of a response scale change the distribution of answers, and what does Dillman recommend?
- When would you use an open question despite the coding cost, and what does Bradburn say about the tradeoff?
- What does a cognitive interview reveal that a field pretest does not, and vice versa?
- Write a ten-item questionnaire on a topic you know, then run it against Fowler's checklist and count how many items you have to rewrite
- Take one of your items and find the closest analogue in Bradburn, Sudman and Wansink's catalogue of tested wordings; compare theirs to yours and note what they anticipated that you did not
- Conduct three think-aloud cognitive interviews on your draft, following Fowler's protocol, and record every point where a respondent's interpretation differed from your intent
- Deliberately reorder two of your items to create an assimilation effect Tourangeau, Rips and Rasinski predict, field both orders to a handful of people, and see whether the effect appears
- Lay out the same five-point scale two ways following Dillman's visual design principles — once well and once badly — and note which layout choices you had been making unconsciously
Next up: You can now write a question that means what you intended; the next stage is about choosing whom to put it to, which is a different discipline entirely.
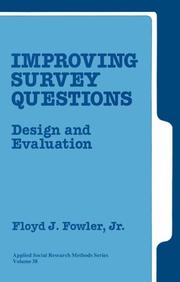
The narrow, practical follow-on to Fowler's overview: how to write a question, and how to find out whether it worked through cognitive interviews and field pretests. Short and immediately usable.
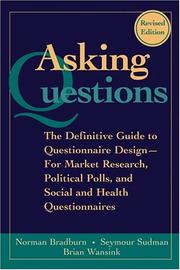
Bradburn, Sudman and Wansink's definitive guide to questionnaire construction, organised by question type — behaviour, attitude, knowledge, sensitive topics — with hundreds of real examples of wordings that failed. The reference you keep open while drafting.

The theory underneath the previous two books, and the intellectual heart of the field: Tourangeau, Rips and Rasinski's four-stage model of what a respondent actually does. Read it after the practical books so you recognise the phenomena it explains.

The tailored design method, and the standard reference for mode and layout decisions — how a question looks on a screen versus on paper, and how to run a survey across several modes without the mode itself becoming a variable. Our record is the fourth edition, the current one.
Sampling design
IntermediateDesign and cost a probability sample: simple random, stratified, cluster and multistage designs, sample size determination, and the weighting that makes an estimate unbiased.
▸ Study plan for this stage
Pace: Three to five months for 1,172 pages, and the pace drops sharply here because this is the first stage that is genuinely mathematics — expect to want probability, expectation and variance at command. Kalton is only 96 pages and is the conceptual scaffold: read it in two sittings before opening either
- Probability sampling and the inclusion probability as the thing that makes an estimate unbiased
- Simple random sampling with and without replacement, and the finite population correction
- Stratification, proportional versus optimal allocation, and why stratifying almost never hurts
- Cluster sampling, the design effect, and the tradeoff of cost against variance
- Multistage designs and probability proportional to size selection
- Design weights, the ratio and regression estimators, and post-stratification
- Sample size determination for a target precision, under each design
- Nonprobability samples and the assumptions that have to be true for them to give anything
- Why does stratification reduce variance, and under what circumstances does it fail to?
- What is a design effect, and how would you use one from a previous survey to size a new one?
- When is a cluster sample the right choice despite the loss of precision, and what makes it right?
- What does probability proportional to size selection buy you, and what does it require you to know in advance?
- How does a design weight differ from a nonresponse adjustment and from a post-stratification factor, and in what order are they applied?
- What has to be assumed for an opt-in online panel to estimate a population mean, and how would you check any of it?
- Derive the variance of the sample mean under simple random sampling without replacement from Kalton's setup, and identify precisely where the finite population correction enters
- Work Lohr's stratified sampling chapter exercises with her datasets in software, computing both proportional and Neyman allocation for the same population and comparing the resulting variances
- Design and cost a two-stage cluster sample of households in a city you know: choose the primary units, state the selection probabilities, and compute the design effect you expect
- Take one of Levy and Lemeshow's health survey examples and redo it under Lohr's notation, to confirm the two books use the same estimators under different names
- Compute the sample size needed for a five-point margin of error on a proportion under simple random sampling, then recompute it with a design effect of two, and note how much of a budget that costs
Next up: You can now design a sample and estimate from it; the next stage supplies the theory that justifies the estimators you have been using and the framework that ties them to the question-writing half of the path.

Under a hundred pages and still the clearest statement of why probability sampling works and what each design buys you. Read it before any of the textbooks; it is the conceptual scaffold they hang detail on.

The best modern textbook on sampling: full derivations, real datasets, software for both R and SAS, and unusually good coverage of nonresponse and nonprobability samples. This is the core text of the path. The catalogue holds it under the bare display title Sampling; our record is the current third edition.
Levy and Lemeshow's health-and-epidemiology counterpart to Lohr, and the better choice if your populations are clinics, households or villages rather than survey panels. Our record is an early edition; the current one adds substantial material on telephone and complex designs.
The standard text and the classical theory
IntermediateWork at the level of the field's own literature: the total survey error framework, and the design-based and model-assisted theory that justifies the estimators you have been using.
▸ Study plan for this stage
Pace: Six months to a year for 1,532 pages, and only Groves is a book to read straight through. Survey methodology, by Groves and the Michigan team, is 488 pages and is the graduate text that unifies both halves of this path under total survey error; work it at 8-10 pages a day and treat its error taxonom
- Total survey error as a framework, and the decomposition into errors of observation and errors of nonobservation
- The design-based paradigm: randomisation as the source of inference, with the population values fixed
- The model-assisted paradigm: a working model used to improve efficiency without being needed for validity
- The Horvitz-Thompson estimator and its variance
- Ratio and regression estimators, and the bias-variance tradeoff they involve
- Calibration estimation and the generalised regression estimator
- Optimal allocation under a cost constraint, in Cochran's classical treatment
- Systematic sampling and the variance problem it creates
- What distinguishes a design-based from a model-based inference, and what does Sarndal's model-assisted position claim to get from both?
- Why is the Horvitz-Thompson estimator unbiased under any probability design, and what makes its variance sometimes unusable?
- Under what conditions does a ratio estimator beat the simple expansion estimator, and how large a sample does it need before its bias is negligible?
- What does calibration do to the weights, and what auxiliary information must exist for it to be possible?
- Why does systematic sampling have no unbiased variance estimator from a single sample, and what do practitioners do about it?
- Where in Groves's total survey error framework does each of the previous three stages of this path sit?
- Draw Groves's total survey error diagram from memory and place under each branch the specific books and chapters from stages one through three that address it
- Derive the variance of the ratio estimator from Cochran and reproduce his approximation argument, noting exactly where the large-sample assumption is used
- Compute Horvitz-Thompson estimates and their variances by hand for a small unequal-probability design, then verify them in software
- Take one estimator you used in Lohr — post-stratification is a good target — and locate it inside Sarndal's calibration framework as a special case
- Work Cochran's optimal allocation problem under a cost model for a stratified survey you designed in the previous stage, and see how far the optimum is from the proportional allocation you chose
Next up: Groves gave you the taxonomy of errors and Sarndal the estimators that assume a clean design; the last stage is about the errors that survive both, and about analysing data from a design rather than pretending it was a simple random sample.

The standard graduate text, by the team at Michigan that largely defined the discipline, and the book that organises everything else here under one idea: total survey error. Read it once you know both halves it unifies. Our record is the first edition and the second is current.

The classic, and still the place to find a derivation nobody else bothers to give — ratio and regression estimators, optimal allocation, systematic sampling. Note that the catalogue record is the 1953 first edition; the third edition of 1977 is the one universally cited and the one to buy.
Sarndal, Swensson and Wretman's unification of the design-based and model-based traditions, and the theoretical summit of this path. Demanding, and the reference for calibration and generalised regression estimation.
Error, nonresponse, and analysing the data you actually got
IntermediateQuantify and adjust for the errors that survive a good design — nonresponse in particular — and analyse complex-design data without pretending it was a simple random sample.
▸ Study plan for this stage
Pace: Three to five months for 1,158 pages, and the two books divide neatly into argument and practice. Groves's Survey errors and survey costs is 590 pages and is a monograph rather than a textbook — the book that made total survey error a framework by pricing each error source against what reducing it c
- Nonresponse rate versus nonresponse bias, and why a high response rate is neither necessary nor sufficient
- The cost side of total survey error: what a percentage point of response rate is worth against what it costs
- Unit and item nonresponse, and the different adjustments each needs
- Weighting class adjustment, propensity weighting and calibration as competing responses to nonresponse
- Imputation methods for item nonresponse, and how imputation uncertainty must enter the variance
- Variance estimation for complex designs: Taylor linearisation, jackknife, balanced repeated replication and the bootstrap
- Why unweighted analysis of a complex sample gets both the point estimate and the standard error wrong, and in which direction
- Subpopulation analysis, and why deleting the other cases before analysis is the wrong way to do it
- Under what model of nonresponse does a high response rate guarantee low bias, and how plausible is that model?
- Given a fixed budget, when is it better to spend on more sample rather than on chasing nonrespondents — how does Groves frame the decision?
- What does a design effect of 2.5 do to the effective sample size, and what does that mean for a subgroup analysis you were planning?
- Why is Taylor linearisation not always available, and when would you prefer a replication method?
- What goes wrong if you analyse a subpopulation by first dropping every other case from the dataset?
- When, if ever, is it defensible to run an unweighted regression on complex survey data?
- Take a public complex-design dataset, fit the same regression weighted and unweighted following Heeringa, West and Berglund, and quantify how much both the coefficients and the standard errors move
- Compute a variance for the same estimate three ways — linearisation, jackknife and balanced repeated replication — and confirm they agree; where they do not, work out why
- Run a subpopulation analysis correctly with the full design retained, then run it the wrong way by subsetting the data first, and record the difference in the standard errors
- Read Groves's cost chapters and write a one-page budget argument for a survey you would like to run, pricing at least three error sources against each other
- Impute a variable with item nonresponse using multiple imputation, then compare the resulting standard errors with those from a single imputation and from complete-case analysis
Next up: This is the end of the path: from here the natural continuations are the responsive and adaptive design literature Groves went on to build, nonprobability inference, and the small area estimation methods that appear once your subgroups get smaller than your design will support.
The book that made total survey error a framework rather than a slogan, by treating each error source alongside what reducing it costs. The single most influential monograph in the field and the argument behind every design tradeoff you have made so far.

The practical ending: how to compute variances, fit regressions and handle weights and strata for data from a complex design, in real software. Heeringa, West and Berglund is where most of the errors in published survey analysis are actually made. Our record is the first edition; a second exists.
Discussion
Keep reading
Paths that share books, cover the same subject, or open a related topic.