Public Opinion and Polling: The Best Books on How Polls Work, in Order
A poll is a measurement, and like any measurement it has a method, an error structure and a set of assumptions that can fail. This path builds up in that order. It starts with how to read a published poll without being fooled — margin of error, house effects, likely-voter screens, and the specific ways election polling has gone wrong. It then treats public opinion as a historical invention rather than a natural object, since the idea that a nation has a measurable opinion is barely a century old. It moves to the political science of what mass opinion actually is and whether it is coherent enough to be worth measuring. And it finishes with the survey methodology books that explain where a sample comes from and how question wording changes the answer. One honest note: John Zaller's The Nature and Origins of Mass Opinion is the field's central theoretical work and does not resolve to a record in this catalogue, so the theory stage below routes around it.
How to Read a Poll
BeginnerInterpret a published poll correctly — what the margin of error does and does not cover, how likely voters are selected, why aggregates beat single polls — and know the documented ways election polling has failed.
▸ Study plan for this stage
Pace: Three to four weeks. Morris's Strength in Numbers is the opener and takes about a week. Asher's Polling and the Public (222 pages) is a classroom guide and can be worked through in a week with a highlighter — buy a recent edition, since it is revised repeatedly. Traugott and Lavrakas's The Voter's G
- A poll is a measurement with a method, an error structure and assumptions that can fail. Everything on this path follows from taking that framing seriously rather than treating a poll as a reading off a dial.
- The margin of error covers sampling variability only. It says nothing about coverage error, non-response bias, question wording, interviewer effects, likely-voter modelling or weighting decisions — and those are where modern polls actually go wrong.
- Likely-voter screens are a modelling choice, not a measurement. Different screens applied to the same raw sample produce materially different headline numbers, which is why two honest pollsters can disagree without either being wrong.
- House effects are systematic differences between pollsters arising from their methodological choices. They are detectable across many polls and are the reason aggregates beat single polls.
- Aggregation helps with random error and does not help with correlated error. When every pollster makes the same modelling mistake, averaging them averages the mistake — which is the short explanation of the most discussed recent misses.
- The response-rate collapse is the defining structural change in modern polling: with very low response rates, who answers becomes the central question, and weighting must do work that random sampling used to do. Morris is recent enough to cover online panels and this shift, which older books predate
- Asher organises his book around the specific things that go wrong — sampling, question wording, interviewer effects, and how results get reported — which makes it the systematic counterpart to Morris's narrative.
- Campbell's history of American polling failures from the earliest famous misfires through the modern ones is the fastest cure for over-trusting a number, and it is placed last in the stage deliberately: three books on method, then the record of the method failing.
- What exactly does the margin of error quantify, and name four sources of error it excludes.
- Two pollsters field on the same days and report different leads. List the methodological choices that could produce the gap without either being incompetent.
- How does a likely-voter screen work, and what happens to a poll's headline if the screen's assumption about turnout composition is wrong?
- When does averaging polls help and when does it not? Give the condition precisely.
- Pick two failures from Campbell's account and say for each whether the cause was sampling, non-response, likely-voter modelling, or late change in the electorate.
- What has the collapse in response rates changed about what a poll is actually measuring?
- Take one published poll and write a full critique from its methodology statement alone: mode, field dates, sample frame, sample size, weighting variables, likely-voter definition, and question wording.
- Track a single race across several pollsters for a month and plot the house effects. They will be visible.
- Rewrite a poll's press release as an honest paragraph that states what is and is not supported by the data.
- For three of Campbell's historical failures, write a one-line diagnosis and a one-line statement of what the industry changed afterwards.
- Find a news story reporting a poll and list every claim in the story that the underlying poll does not support.
Next up: Knowing how the instrument works raises the question of where it came from — and public opinion as a measurable national quantity turns out to be a recent invention with a purpose.

The best current single volume: a working election forecaster on how modern polling is done, its history, and what went wrong in 2016 and 2020. Start here because it is recent enough to cover online panels and the response-rate collapse that older books predate.

The standard classroom guide to being a critical consumer of polls, organised around the specific things that go wrong: sampling, question wording, interviewer effects, and the reporting of results. Read second as the systematic version of Morris's narrative. Revised repeatedly, so buy a recent edition.
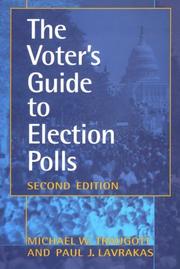
A short question-and-answer handbook by two survey methodologists, written for journalists and voters. Placed here as the reference to keep beside you during an election rather than to read through. Co-authored with Paul Lavrakas; note that the record catalogued here is a late-1990s edition.

A media historian's account of every major American polling failure from 1936 to 2016 — Literary Digest, Dewey, and the modern misses. Read it last in this stage: after three books on method, this is the record of the method failing, and it is the fastest cure for over-trusting a number.
Where the Idea of Public Opinion Came From
IntermediateTreat public opinion as a historical construction with an inventor and a purpose, and understand what the survey replaced and what it made invisible.
▸ Study plan for this stage
Pace: Three to four weeks for around 1,065 pages. Lippmann's Public Opinion (427 pages) is written in a dense early-twentieth-century register and rewards slow reading — ten days. Igo's The Averaged American (408 pages) is a work of history and takes about ten days. Herbst's Numbered Voices (231 pages) is
- Lippmann's book was written before scientific polling existed, and it states the problem the whole field inherited: citizens act on the pictures in their heads rather than on the world, and those pictures are assembled from limited, mediated and selected information.
- Lippmann introduced the stereotype in its technical sense — a cognitive shortcut that makes an unmanageably complex environment tractable — which is a description of how cognition works rather than a term of abuse.
- The pseudo-environment is Lippmann's name for the represented world people actually respond to, and it is the ancestor of every later argument about media effects, framing and agenda-setting.
- Igo's history shows how Americans learned to see themselves through surveys, tracing community studies, opinion polling and large-scale sex research, and how survey findings became a mirror people used to locate themselves as normal or otherwise.
- Reflexivity is the sharp part of Igo's argument: measuring a public helps to create one. Publishing what the average American thinks changes what people think, and it also establishes who counts as an American for the purpose of the average.
- Herbst asks what forms of expressing public opinion the poll displaced — crowds, petitions, straw votes, the partisan press — and what was lost when opinion became a percentage rather than an act.
- The poll aggregates individuals equally and asynchronously, which is a specific and consequential design choice: intensity, organisation and willingness to act are all invisible to it, and those were exactly what the older forms conveyed.
- Jean Converse's Survey Research in the United States covers the same period from the profession's own side, if you want the institutional history alongside the critical one.
- What is Lippmann's argument about the relationship between citizens, the press and the world? Restate it without using the word stereotype.
- How does Lippmann's pseudo-environment relate to modern claims about media effects? What did he anticipate and what could he not have?
- What does Igo mean by Americans learning to see themselves through surveys? Give two concrete mechanisms from the book.
- How can measuring a public help create one? Identify a specific case where the measurement changed the thing measured.
- According to Herbst, what did the poll displace, and what could those older forms express that a percentage cannot?
- Is the equal weighting of individuals in a poll a virtue or a distortion? Argue both sides.
- Write out Lippmann's chain from event to public opinion as numbered steps, and mark at which step each modern communication technology intervenes.
- From Igo, list the surveys that shaped American self-understanding and note for each who was included in the sample and who was not.
- Take one current political controversy and describe how public opinion on it would be expressed under each of Herbst's older forms. Note what each form would reveal that polling does not.
- Find a poll result on an issue where intensity clearly matters and write a paragraph on what the percentage conceals.
- Summarise in 400 words what changed when public opinion became a number, drawing on all three books.
Next up: If a public opinion can be measured, the next question is whether the thing being measured is coherent enough to be worth measuring — which is where political science takes over from history.
Lippmann's 1922 book, written before scientific polling existed, and still the foundational statement of the problem: citizens act on pictures in their heads, not on the world. The origin of the stereotype in its technical sense, and the argument every later theorist is answering.

A historian's account of how Americans learned to see themselves through surveys — the Middletown studies, Gallup, and Kinsey. The best book here on the reflexive part of the problem: measuring a public helps create one. Read directly after Lippmann to see the machinery arrive.
Herbst asks what forms of expressing public opinion the poll displaced — crowds, petitions, straw votes, the partisan press — and what was lost when opinion became a percentage. The sharpest critical framing on this path, and short. Jean Converse's Survey Research in the United States covers the same period from the profession's side.
What Mass Opinion Actually Is
IntermediateEngage the political science on whether individual opinions are stable and informed, whether aggregate opinion behaves sensibly anyway, and what that implies for democratic theory.
▸ Study plan for this stage
Pace: Five to six weeks for around 1,625 pages. Erikson and Tedin's American Public Opinion (384 pages) is the survey text and should be read first over ten days. Page and Shapiro's The Rational Public (489 pages) and Achen and Bartels's Democracy for Realists (408 pages) are the two poles of the argument
- The core empirical problem: individual survey responses are often unstable over time and weakly connected to underlying attitudes, which raises the question of whether they measure an opinion at all or a response constructed on the spot.
- Erikson and Tedin's text supplies the established findings — political socialisation, ideological constraint, group differences, and the link between opinion and policy — and is deliberately read first so that the arguments have something to argue about.
- Page and Shapiro's claim is the optimistic pole: although individuals are ill-informed and individually unstable, aggregate opinion moves coherently and sensibly in response to events, because individual noise cancels while systematic signal accumulates.
- That aggregation argument is the reason poll averages are worth taking seriously at all, and it has a clear failure condition — if errors are correlated rather than random, aggregation preserves the bias, which is the same lesson as house effects in the first stage.
- Achen and Bartels's claim is the pessimistic pole: voters are driven by group identity and by retrospective blame rather than by policy views, and they present evidence that electorates punish incumbents for events well outside government control. Retrospective voting versus policy voting is the sub
- Since Zaller's work is not available on this path, hold the gap explicitly rather than filling it: his account of how citizens sample considerations at the moment of answering is the standard explanation for response instability, and the books here address the phenomenon without offering that model.
- Lupia turns the descriptive dispute into a practical question — given that attention is genuinely scarce, what would it take to inform citizens usefully — which makes it the most immediately applicable book here for anyone who has to communicate survey findings.
- The democratic-theory stakes are real: if opinion is incoherent, responsiveness to it is not obviously a virtue, and both poles of this argument have to say something about what representation should track.
- What is the evidence that individual survey responses are unstable, and what are the competing explanations for that instability?
- State Page and Shapiro's aggregation argument precisely, including the condition under which it fails.
- What do Achen and Bartels claim voters are actually responding to, and what is the strongest objection to their evidence? Page and Achen use overlapping data and reach opposite conclusions — where exactly does the disagreement lie: in the data, the measures, or the interpretation?
- Zaller's model is missing from this stage. What phenomenon would it explain, and which of the available books comes closest to addressing it?
- If citizens are as Achen and Bartels describe them, what should democratic institutions be designed to track instead of opinion?
- What does Lupia argue it would actually take to inform a citizen usefully, and what does that imply for how you would present a poll finding?
- Build a two-column table of Page and Shapiro's claims against Achen and Bartels's, matched claim by claim, with the evidence each offers.
- Take one long-running poll trend and assess it under both models: does it look like a rational public responding to events, or like retrospective blame and group identity?
- Write a one-page statement of what a survey response actually is, given everything in this stage, and mark where you are uncertain because of the missing Zaller material.
- Apply Lupia's framework to a real communication task: state a survey finding for an audience with thirty seconds of attention, and say what you chose to drop and why.
- Find a case where an electorate punished an incumbent for something outside their control, and evaluate it against Achen and Bartels's account.
Next up: The theory tells you what opinion is; the last stage covers how it is actually captured — where a sample comes from, and how much of a measured opinion is an artefact of the question.

The standard undergraduate text by Erikson and Kent Tedin, covering political socialisation, ideology, group differences and the opinion-policy link. Read it first here as the survey of established findings before you meet the arguments about them.
Page and Robert Shapiro's analysis of fifty years of survey data, arguing that although individuals are ill-informed and unstable, aggregate opinion moves coherently in response to events. The optimistic pole of the debate, and the reason poll averages are worth taking seriously at all.
The pessimistic pole: Achen and Larry Bartels argue voters are driven by group identity and retrospective blame rather than by policy views, and present evidence that voters punish incumbents for droughts and shark attacks. Read it directly against Page — the disagreement is the substance of this stage.

Lupia's answer to both: given that attention is scarce, what would it actually take to inform citizens usefully? Placed last because it turns the descriptive debate into a practical question, and because it is the most useful book here for anyone who has to communicate survey findings.
Doing It: Sampling and Question Design
IntermediateUnderstand where a sample comes from, what non-response does to it, and how much of a measured opinion is an artefact of how the question was asked.
▸ Study plan for this stage
Pace: Six to eight weeks for around 1,520 pages, and this is the technical stage. Bradburn, Sudman and Wansink's Asking Questions (426 pages) comes first and takes ten days — it is the least mathematical and the highest-yield. Groves's Survey Methodology (488 pages) is the standard graduate text and shoul
- Question wording is the largest source of error most readers have never considered, and it is the least mathematical to understand. Small changes in wording, order and response options move results by margins that dwarf sampling error.
- The specific effects to learn by name: order and context effects, acquiescence bias, social desirability on threatening questions, the treatment of don't-know options, and how response scales shape the distribution of answers.
- Total survey error is Groves's organising framework: coverage error, sampling error, non-response error and measurement error considered together, with trade-offs between them rather than each optimised alone.
- Coverage error concerns who could possibly be reached by the sample frame at all, and it is the error that changes most as modes shift from landlines to mobiles to online panels.
- Non-response error depends on whether non-respondents differ from respondents on the variable of interest, not on the response rate itself. A low response rate is a warning sign rather than a proof of bias, which is a distinction most reporting gets wrong.
- Weighting corrects a sample toward known population characteristics, and it necessarily assumes that respondents represent non-respondents within each weighting cell. Choosing the weighting variables is a substantive judgement, and it is where modern polls most often go wrong.
- Design effects, stratification and clustering mean the effective sample size is usually smaller than the number of interviews, which is why the reported margin of error on a complex design is not the simple formula.
- Lohr supplies the statistics — stratification, clustering, weighting and variance estimation with derivations — and is the right place to stop, because these are the decisions that determine whether the number at the top of the release means anything.
- Take one contested policy question and write it three ways that would each produce a different result. Identify which effect each version exploits.
- What is total survey error, and how do the four components trade off against each other in a fixed budget?
- Why is a low response rate not the same as non-response bias? State the condition under which a low response rate is harmless.
- What assumption does weighting make, and how would you know if it were violated?
- Explain design effect and effective sample size. Why is the simple margin of error usually optimistic for a real survey?
- Given everything in this stage, rewrite your critique of the poll you analysed in the first stage. What can you now say that you could not before?
- Write a short questionnaire on a topic you know, then deliberately produce a biased version of the same instrument. Being able to construct the bias is the test of understanding it.
- Take a published poll's weighting variables and reason about who is likely to be over- or under-represented before weighting, and whether the chosen variables would fix it.
- Work through the stratified and cluster sampling derivations in Lohr for a small example by hand, and compute the design effect.
- Redesign a real survey under a halved budget and document which component of total survey error you chose to worsen and why.
- Finish the path by writing a full methodological review of one recent election poll, covering frame, mode, non-response, weighting, likely-voter model and question wording, and stating plainly what the poll can and cannot support.
Next up: That closes the path: how to read a poll, where the idea of a measurable public came from, what mass opinion is and is not, and how a survey is actually built — with the honest gap that the field's central theoretical work is not in this catalogue and has to be sought separately.
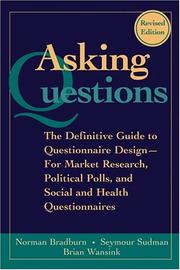
Bradburn, Seymour Sudman and Brian Wansink on questionnaire design: order effects, acquiescence, threatening questions, response scales. Start the technical stage here, because question wording is the largest source of error most readers have never thought about and the least mathematical to understand.

The standard graduate textbook, and the systematic treatment of total survey error — coverage, sampling, non-response and measurement together. Demanding but not proof-heavy; this is the book that makes the difference between reading polls and evaluating them.

The statistics of it: stratification, clustering, weighting and variance estimation, with real derivations. The most technical book on the path and the right place to stop, since weighting decisions are where modern polls most often go wrong. Catalogued under the bare title Sampling.
Discussion
Keep reading
Paths that share books, cover the same subject, or open a related topic.