Learn Power BI: the best books in order
This curriculum takes a beginner from zero Power BI experience to advanced data modeling, DAX mastery, and professional dashboard design across four carefully sequenced stages. Each stage builds directly on the vocabulary, concepts, and hands-on skills established in the previous one, ensuring no critical gap is left before moving to deeper material.
Foundations: Getting Started with Power BI
BeginnerUnderstand the Power BI ecosystem, navigate the interface confidently, connect to data sources, build basic reports and dashboards, and publish to the Power BI Service.
▸ Study plan for this stage
Pace: 4–5 weeks, ~40–50 pages/day (approximately 280–350 pages total across both books)
- Power BI ecosystem architecture: Desktop, Service, and Mobile apps and their roles in the analytics workflow
- Power BI Desktop interface navigation: ribbon, data model view, report canvas, and query editor
- Data connectivity and transformation: connecting to diverse sources (Excel, SQL, cloud services) and using Power Query for cleaning and shaping
- Data modeling fundamentals: relationships, cardinality, and building a star schema for analytical queries
- DAX (Data Analysis Expressions) basics: creating calculated columns and measures for business logic
- Report and dashboard design: visualizations, filters, slicers, and interactive elements for storytelling
- Publishing and sharing: moving reports from Desktop to Power BI Service and managing permissions and refresh schedules
- What are the three main components of the Power BI ecosystem and what role does each play in the analytics workflow?
- How do you connect Power BI Desktop to different data sources, and what is the purpose of the Power Query editor in the data transformation process?
- What is a relationship in Power BI's data model, and why is cardinality important when designing a star schema?
- How do calculated columns and measures differ in DAX, and when should you use each one?
- What are the key design principles for creating an effective interactive report or dashboard in Power BI?
- How do you publish a Power BI report to the Service, and what are the main considerations for scheduling data refreshes and managing access?
- Set up Power BI Desktop and connect to at least two different data sources (e.g., an Excel file and a SQL database or cloud service) using the connection wizards covered in the Quick Start Guide
- Import a messy dataset and use Power Query to clean it: remove duplicates, split columns, filter rows, and apply transformations as demonstrated in Ferrari's book
- Create a basic data model with at least two related tables, define relationships with appropriate cardinality, and verify the model structure in the Model view
- Build a calculated column using DAX (e.g., full name from first and last name) and a measure (e.g., total sales or average) to answer a specific business question
- Design a multi-page report with at least 3–4 visualizations (bar chart, line chart, table, card) that tell a cohesive story about your data, incorporating slicers and filters for interactivity
- Publish your completed report to Power BI Service, set up a refresh schedule for the data, and share it with at least one other user with appropriate permission levels
Next up: This foundation stage equips you with the core skills to build functional reports and dashboards; the next stage will deepen your expertise in advanced data modeling, complex DAX formulas, and performance optimization to handle enterprise-scale analytics scenarios.
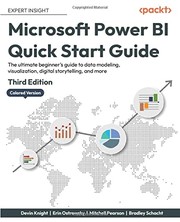
A concise, beginner-friendly introduction that walks through the entire Power BI workflow — from importing data to publishing reports — giving new learners a complete mental map before diving deeper.

Introduces the foundational concept of data modeling and relationships in a highly accessible way, bridging familiar Excel thinking with the Power BI data model — essential groundwork before tackling DAX.
Data Modeling & DAX Essentials
IntermediateDesign clean, efficient data models using star schemas, write correct and performant DAX measures, and understand evaluation contexts — the core engine behind all Power BI calculations.
▸ Study plan for this stage
Pace: 8–10 weeks, ~40–50 pages/day (mix of dense technical content and hands-on practice)
- Star schema design: fact tables, dimension tables, and relationships for analytical queries
- DAX syntax and semantics: row context, filter context, and context transition
- Evaluation contexts: how CALCULATE, FILTER, and ALL modify the filter context for measures
- Writing performant DAX: avoiding common pitfalls like row-by-row iteration and unnecessary context switches
- Implicit and explicit measures: when to use calculated columns vs. measures vs. calculated tables
- Advanced DAX functions: SUMX, AVERAGEX, RANKX, and other X-functions for complex calculations
- Denormalization and optimization trade-offs: balancing model clarity with query performance
- Real-world patterns: time intelligence, YTD/MTD calculations, and dynamic filtering
- What is the difference between row context and filter context, and how does CALCULATE transition between them?
- How would you design a star schema for a retail business with sales, products, customers, and dates? What are the fact and dimension tables?
- Write a DAX measure that calculates year-to-date sales and explain how ALL() and DATESBETWEEN() work in the filter context.
- When should you use a calculated column vs. a measure, and what are the performance implications of each?
- How do SUMX and FILTER differ from SUM and CALCULATE, and when would you use one over the other?
- What is context transition, and how does it affect the behavior of a measure called from a calculated column?
- Build a star schema from raw transactional data: create a fact table (sales), dimension tables (date, product, customer), and define relationships. Document your design choices.
- Write 5–10 DAX measures for a sample dataset: total sales, average order value, sales YTD, sales growth vs. prior year, and top 5 products by revenue. Test each in a matrix visual.
- Refactor a poorly written DAX measure (provided or from your own work) by identifying row-by-row iteration, unnecessary context switches, and rewriting it for performance.
- Create a time intelligence suite: YTD, MTD, QTD, and year-over-year growth measures. Validate results against manual calculations.
- Design and implement a dynamic slicer measure using CALCULATE and ALL to show sales for a selected region vs. all regions.
- Analyze a complex real-world scenario (e.g., multi-level hierarchies, non-additive measures) and propose a DAX solution with trade-off analysis.
Next up: This stage equips you with the foundational data modeling and DAX skills to build robust analytical solutions; the next stage will focus on advanced optimization, performance tuning, and scaling these models to enterprise-size datasets and complex business requirements.

The single most authoritative and comprehensive book on DAX; starting here after basic modeling knowledge ensures the reader can absorb filter context, CALCULATE, and iterators with full understanding.
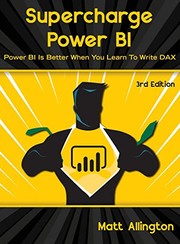
Focuses specifically on DAX from a practical, business-analyst perspective with progressive exercises, reinforcing and applying what was learned in the Definitive Guide through real-world scenarios.
Advanced Analytics & Power Query
IntermediateMaster data transformation with Power Query (M language), handle complex data preparation challenges, and apply advanced analytical patterns in DAX for time intelligence, ranking, and segmentation.
▸ Study plan for this stage
Pace: 4–5 weeks, ~40–50 pages/day, with 2–3 days per week dedicated to hands-on DAX implementation in Power BI
- DAX formula syntax, operators, and evaluation contexts (row, filter, query)
- Time intelligence patterns (YTD, MTD, same-period-last-year, moving averages)
- Ranking and segmentation patterns (RANKX, TOPN, percentile-based grouping)
- Iterator functions and their performance implications (SUMX, AVERAGEX, FILTER)
- Context transition and CALCULATE for dynamic filtering and measure manipulation
- Handling complex business logic with nested conditions and multiple criteria
- Performance optimization through efficient DAX patterns and avoiding common pitfalls
- How do row context and filter context differ in DAX, and when does context transition occur?
- Write a DAX formula to calculate year-to-date sales and compare it to the same period last year.
- What is the difference between SUMX and SUM, and when should you use each?
- How would you create a ranking measure that handles ties and updates dynamically based on slicer selections?
- Explain the purpose of CALCULATE and provide an example of how it modifies filter context.
- Design a segmentation pattern that categorizes customers into quintiles based on lifetime value.
- Build a time intelligence dashboard with YTD, MTD, and year-over-year growth measures using CALCULATE and date functions.
- Create a ranking measure using RANKX that ranks products by sales within each category and handles ties appropriately.
- Implement a moving average calculation (e.g., 3-month or 12-month rolling average) using DATEADD and SUMX.
- Develop a customer segmentation model using quintile-based DAX formulas (PERCENTILE.INC or RANKX) and visualize segments in a matrix.
- Refactor an inefficient DAX measure using iterator functions and CALCULATE to improve performance; document the before/after impact.
- Build a complex measure that calculates sales with multiple dynamic filters (e.g., top 10 products, current year, selected region) using nested CALCULATE statements.
Next up: This stage equips you with advanced DAX patterns and time-intelligence expertise, establishing the foundation for the next level where you'll apply these patterns to enterprise-scale data models, optimize complex calculations for large datasets, and integrate Power Query transformations with sophisticated analytical measures.

A pattern-based reference covering time intelligence, ABC analysis, segmentation, and more — best absorbed after core DAX is solid, turning knowledge into reusable, professional-grade solutions.
Professional Dashboards, Reports & Enterprise Deployment
ExpertDesign visually compelling, user-centered reports and dashboards, apply best practices for storytelling with data, optimize performance, and deploy solutions at enterprise scale in the Power BI Service.
▸ Study plan for this stage
Pace: 6–8 weeks, ~25–35 pages/day, with 2–3 days per week dedicated to hands-on dashboard design and optimization projects
- Data storytelling fundamentals: understanding your audience, choosing the right visualization type, and eliminating clutter to drive narrative clarity
- Visual design principles: color theory, typography, layout, and gestalt principles to guide viewer attention and comprehension
- Context and pre-attentive attributes: leveraging position, color, and size to make key insights immediately visible without conscious effort
- Performance optimization in Power BI: query folding, DAX optimization, aggregations, and incremental refresh to handle large-scale datasets
- Report design best practices: interactive filtering, drill-through capabilities, bookmarks, and tooltips for user-centered exploration
- Enterprise deployment patterns: row-level security (RLS), capacity planning, gateway configuration, and refresh scheduling for production environments
- Accessibility and inclusive design: ensuring dashboards are usable by all audiences, including those with color blindness or visual impairments
- Monitoring and maintenance: using Power BI Service analytics to track report performance, user adoption, and identify optimization opportunities
- How do you determine the appropriate visualization type for a given dataset and business question, and what are the pitfalls of common visualization choices?
- What is the role of pre-attentive processing in data visualization, and how can you leverage it to improve dashboard effectiveness?
- Describe the key performance bottlenecks in Power BI and the specific optimization techniques (query folding, DAX, aggregations) you would apply to address each
- How would you design a dashboard for multiple user personas with different information needs, and what interactive features would you implement?
- What are the critical considerations for deploying a Power BI solution to an enterprise environment, including security, capacity, and refresh strategy?
- How do you balance visual appeal with accessibility, and what specific design choices ensure your dashboards are inclusive?
- Redesign an existing cluttered dashboard or report by applying Knaflic's principles: remove non-data-ink, choose appropriate chart types, and add narrative context. Document your design decisions
- Create a multi-page report for 3 different user personas (e.g., executive, analyst, operations manager) using the same underlying dataset, with role-specific filtering and drill-through paths
- Conduct a performance audit on a Power BI model: identify slow queries, implement query folding, optimize DAX measures, and document the before/after refresh times and query performance
- Build an interactive dashboard with bookmarks and buttons that guide users through a data story—e.g., 'Sales Performance Overview' → 'Regional Deep Dive' → 'Product Analysis'
- Design and implement row-level security (RLS) for a multi-tenant dataset, then test access controls across different user roles
- Create an accessibility audit of a sample dashboard: check color contrast, test with a color-blindness simulator, add alt text to visuals, and redesign any inaccessible elements
Next up: This stage equips you with the strategic and technical skills to create production-grade, user-centric analytics solutions; the next stage will likely focus on advanced analytics integration (Python/R), AI-driven insights, or specialized domains (financial analytics, supply chain) where these foundational storytelling and deployment skills become the platform for deeper analytical sophistication.
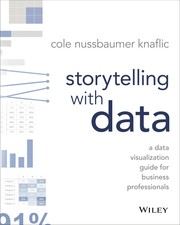
Though tool-agnostic, this is the canonical book on data visualization principles and dashboard storytelling — reading it here ensures Power BI reports communicate insights clearly, not just display numbers.

Addresses query optimization, data model performance, and enterprise-scale deployment considerations — the right capstone for a learner who now has strong modeling, DAX, and design skills and needs to productionize their work.
Discussion
Keep reading
Paths that share books, cover the same subject, or open a related topic.