Anyone can pull a chart out of a dataset. The hard part of data analytics is knowing whether the chart means anything — whether a difference is real, whether a metric is misleading, whether the story you are about to tell is honest. Tools are learnable in an afternoon; judgment takes a while, and it has to come first.
So this path front-loads intuition. You build a feel for statistics and its common lies, then learn to compute at scale with Python, then master the visualization and communication that make insight land. Reversing that order produces analysts who run the numbers but cannot tell if they are right.
Build statistical intuition
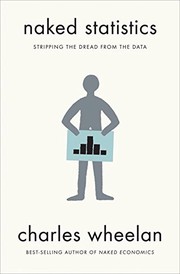
Start with Naked Statistics, which teaches the concepts that matter — variance, correlation, regression, inference — in plain language and with real examples. Read How to Lie with Statistics right after; it is short, old, and permanently useful as a guide to how numbers deceive. Then The Art of Statistics by David Spiegelhalter modernizes the whole picture with a data-first, problem-driven approach.
Compute at scale with Python
Now the tools. Automate the Boring Stuff with Python gets you writing practical scripts if you are new to the language, and Python For Data Analysis by pandas' creator Wes McKinney is the workhorse for cleaning, reshaping, and aggregating real datasets. Python Data Science Handbook extends that into NumPy, visualization, and machine learning basics — the full analytical toolkit.
Communicate what you found
An unread insight is worthless. Storytelling with Data teaches the discipline of removing clutter and directing attention, and Fundamentals of Data Visualization by Claus Wilke grounds the aesthetics in principled rules about which chart says what.
Deepen the rigor
For serious analysts, go further. Statistics by David Freedman is a rigorous, careful foundation, and Practical Statistics for Data Scientists: 50 Essential Concepts connects that rigor to day-to-day analytical work. Thinking, fast and slow explains the cognitive biases that distort how you and your stakeholders read data, and Competing on Analytics shows how organizations turn all of this into an actual advantage.
Follow the path in order and you become the analyst people trust — not because you can make a chart, but because you know when the chart is telling the truth.
Follow the full reading path →
Ready to learn something deeply?
Build a reading path — free