Why weather works: meteorology, explained
This curriculum takes a complete beginner from casual sky-watcher to someone who genuinely understands the atmosphere, can read weather maps, and follows how professional meteorologists think. The four stages move from intuitive observation and wonder, through the physical science of the atmosphere, into forecasting tools and techniques, and finally into the dramatic world of extreme weather — each stage building directly on the vocabulary and concepts of the last.
Foundations — Learning to Look Up
BeginnerBuild an intuitive feel for weather as a daily, observable phenomenon; learn cloud types, basic sky reading, and the language meteorologists use.
▸ Study plan for this stage
Pace: 8–10 weeks total. Weeks 1–5: "The Cloudspotter's Guide" (~25–30 pages/day, reading one cloud-genus chapter at a time and pausing to sky-watch before moving on). Weeks 6–10: "The Weather Observer's Handbook" (~20–25 pages/day, slower pace to absorb instrument details and recording protocols). Reserve
- The ten classical cloud genera (Cumulus, Stratus, Cirrus, etc.) and how altitude, shape, and process define each one, as introduced chapter-by-chapter in The Cloudspotter's Guide
- Cloud formation physics: the role of rising air, cooling, condensation nuclei, and the dew point — the conceptual backbone Pretor-Pinney weaves through every cloud type
- Sky reading as a predictive skill: recognising sequences of cloud types (e.g., Cirrus → Cirrostratus → Altostratus) as early signals of approaching frontal weather
- The language of meteorology: standard WMO terminology for clouds, precipitation types, visibility, and sky cover introduced and normalised across both books
- Systematic observation and the observer's mindset: how The Weather Observer's Handbook frames personal discipline — fixed times, consistent siting, and calibrated instruments — as the foundation of meaningful data
- Surface weather elements: temperature, humidity, pressure, wind speed/direction, precipitation, and sunshine — what each measures and why each matters, per Burt's instrument-by-instrument treatment
- Recording and logging: how to construct a personal weather register, choose observation times, and spot errors in your own data, following Burt's guidance on station setup and data quality
- The interplay between qualitative sky observation (Pretor-Pinney) and quantitative instrument reading (Burt) as two complementary lenses on the same atmosphere
- Can you name and describe all ten cloud genera, give the altitude band each occupies, and explain the atmospheric process most responsible for forming each one — drawing on Pretor-Pinney's chapter structure?
- Walking outside right now, what sequence of cloud changes would make you confident a warm front is approaching, and what weather would you expect in the next 12–24 hours?
- According to Burt's The Weather Observer's Handbook, what are the critical siting rules for a standard thermometer screen (Stevenson screen), and why does violating them invalidate your temperature record?
- What is the difference between dew point and relative humidity, and how does each figure into the formation of the cloud types Pretor-Pinney describes?
- How does Burt recommend you handle a missed observation, a suspected instrument fault, or an outlier reading in your weather register — and why does data integrity matter even for an amateur station?
- How do the skills practised in Pretor-Pinney's qualitative cloud-spotting complement rather than duplicate the quantitative measurements Burt describes — and what can each approach tell you that the other cannot?
- Cloud journal (runs the full stage): Each day, step outside at a fixed time, identify every cloud genus visible using Pretor-Pinney's descriptions, photograph or sketch them, and write two sentences on what weather they suggest. Review weekly to track your improving accuracy.
- Chapter-confirmation walks: After finishing each cloud-genus chapter in The Cloudspotter's Guide, go outside specifically hunting for that cloud type. Don't move to the next chapter until you've spotted — or consciously failed to spot and reasoned why — the cloud in question.
- Build a personal weather register from scratch: Following Burt's station-setup and recording guidance, create a paper or spreadsheet log with columns for date/time, temperature, humidity, pressure, wind, precipitation, cloud cover, and cloud types. Maintain it for at least the final four weeks of the stage.
- Instrument audit: Using Burt's siting and instrument chapters as a checklist, evaluate one real or hypothetical observation site (your garden, a school roof, a local weather station's public photos). List every siting error you can identify and explain the bias each would introduce.
- Sequence prediction drill: Once a week, observe the sky in the morning, write down your cloud-type sequence and a 24-hour forecast in plain language, then verify against the actual outcome that evening. Keep a running score of hits and misses to build honest self-assessment.
- Glossary construction: As you read both books, maintain a running two-column glossary — WMO/meteorological term on the left, your own plain-language definition on the right. Aim for at least 60 terms by the end of the stage; quiz yourself before moving to Stage 2.
Next up: Mastering cloud identification and disciplined surface observation gives the reader the perceptual vocabulary and data-collection habits needed to make sense of the larger atmospheric systems — fronts, pressure patterns, and synoptic charts — that a more intermediate stage will introduce.
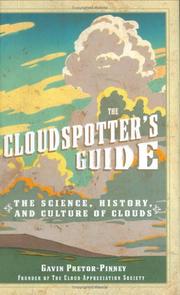
A joyful, accessible introduction to cloud classification that makes the reader genuinely curious about the sky. It establishes the core vocabulary (cumulus, stratus, cumulonimbus, etc.) that every later book assumes you know.

Bridges casual observation and real meteorological practice by explaining what professional observers actually measure and record — perfect for grounding the reader in concrete, repeatable sky-reading skills before moving to theory.
The Science of the Atmosphere
BeginnerUnderstand why weather happens — air pressure, fronts, the water cycle, wind, and the global circulation patterns that drive local conditions.
▸ Study plan for this stage
Pace: 10–12 weeks total. Weeks 1–7: "Meteorology Today" by Ahrens (~25–30 pages/day, focusing on Chapters 1–12 covering atmosphere basics, temperature, moisture, clouds, precipitation, air pressure, winds, and weather systems). Weeks 8–12: "The Atmosphere" by Lutgens (~20–25 pages/day, using it to reinfor
- Atmospheric composition and vertical structure (troposphere, stratosphere, etc.) as introduced in the opening chapters of both Ahrens and Lutgens
- Air pressure and its relationship to altitude, temperature, and density — a thread running through both books
- The water cycle: evaporation, condensation, precipitation, and how Ahrens explains dew point, humidity, and cloud formation in detail
- Cloud types and formation processes as categorized and illustrated in Ahrens' chapters on moisture and clouds
- Wind: causes (pressure gradient force, Coriolis effect, friction) and surface vs. upper-level patterns, covered extensively in Ahrens' wind chapters
- Weather fronts (cold, warm, stationary, occluded) and the mid-latitude cyclone model, a centerpiece of Ahrens' coverage of weather systems
- Global atmospheric circulation: Hadley cells, trade winds, jet streams, and how Lutgens frames these as drivers of regional climates
- Energy balance and heat transfer (radiation, conduction, convection) as explained in both books' early chapters on solar energy and temperature
- After reading Ahrens' chapters on pressure and winds, can you explain why wind blows from high to low pressure and how the Coriolis effect deflects it in each hemisphere?
- Using Ahrens' moisture chapters as your guide, trace a water molecule through the full water cycle — from ocean surface to raindrop — naming the key processes at each step.
- How do cold and warm fronts differ in structure, cloud sequence, and the weather they produce, as described in Ahrens' weather systems chapters?
- How does Lutgens explain the role of Hadley cells and the Inter-Tropical Convergence Zone (ITCZ) in shaping global precipitation patterns?
- Both Ahrens and Lutgens discuss the vertical layers of the atmosphere — what defines the boundary of each layer, and why does temperature behave differently in the troposphere vs. the stratosphere?
- What is the jet stream, and how does its position (as described in both books) influence the day-to-day weather experienced at mid-latitudes?
- Weather journal (ongoing, all 12 weeks): Each day, record local temperature, cloud types (using Ahrens' cloud classification chapter as a reference), wind direction, and pressure if available. At week's end, try to identify any frontal passages from your notes.
- Pressure-altitude experiment: Use a free barometer app or a physical barometer and record readings at ground level vs. the top of a tall building or hill. Compare your results to the pressure-altitude relationship described in Ahrens.
- Draw the global circulation model from memory after finishing Lutgens' global circulation chapters — include all major cells (Hadley, Ferrel, Polar), surface wind belts, and the ITCZ. Check it against Lutgens' diagrams.
- Front-tracking exercise: Download a week's worth of archived daily surface weather maps (NOAA's Weather Prediction Center archives are free). Using Ahrens' fronts chapter as your guide, identify and label cold fronts, warm fronts, and low-pressure centers each day and watch how the system evolves.
- Water cycle diagram: Without looking at either book, draw and annotate a complete water cycle diagram. Then open both Ahrens and Lutgens and compare — add any processes or vocabulary you missed.
- Concept comparison table: Create a two-column table for five major topics (pressure, fronts, global circulation, clouds, energy balance). In each column, summarize how Ahrens and Lutgens each approach the topic — note where they complement each other and where one goes deeper.
Next up: Mastering why weather happens — the pressure gradients, frontal dynamics, and circulation patterns laid out in Ahrens and Lutgens — gives you the physical intuition needed to tackle how weather is observed, modeled, and forecast in more advanced stages.
The most widely used introductory meteorology textbook in the world; it explains atmospheric physics, fronts, and storm formation in clear prose with excellent diagrams. Reading it after the cloud books means the science immediately connects to things you have already seen in the sky.

A complementary introductory text that emphasizes global circulation, jet streams, and climate context — filling in the big-picture 'why' that sits behind local forecasts.
Storms, Extremes & Deep Mastery
ExpertDevelop a deep understanding of severe weather — thunderstorms, tornadoes, hurricanes, and winter storms — and appreciate the cutting edge of meteorological science.
▸ Study plan for this stage
Pace: 10–12 weeks total. Weeks 1–8: "Severe and Hazardous Weather" by Rauber (~40–50 pages/day, 4–5 days/week), working chapter by chapter through each storm type. Weeks 9–11: "Storm Chaser" by Jim Reed (~25–30 pages/day), reading alongside field-journal reflection sessions. Week 12: Integration week — re
- Mesoscale convective systems (MCS) and supercell thunderstorm structure, including updraft/downdraft dynamics, wall clouds, and hook echoes
- Tornado genesis: vorticity, wind shear, rotating updrafts, and the lifecycle from funnel cloud to dissipation
- Hurricane structure and energetics: eye, eyewall, rainbands, sea-surface temperature dependence, and the Saffir-Simpson scale
- Winter storm mechanics: nor'easters, lake-effect snow, ice storms, and the role of the jet stream and cold-air damming
- Hazardous weather forecasting tools: Doppler radar interpretation, skew-T/log-P diagrams, CAPE, CIN, and hodographs
- Flash flood meteorology: convective rainfall rates, soil saturation, and topographic enhancement
- Risk communication and the human dimensions of severe weather warnings (watch vs. warning systems, lead times, public response)
- Cutting-edge observational science: storm-chasing field campaigns (as depicted by Jim Reed), mobile Doppler units, and photographic documentation as scientific evidence
- Using concepts from Rauber, explain how wind shear and atmospheric instability (CAPE) interact to produce a supercell thunderstorm rather than an ordinary cell.
- What distinguishes a tornadic supercell from a non-tornadic supercell on a radar display, and what environmental parameters (per Rauber) are most predictive of tornado formation?
- How does sea-surface temperature fuel hurricane intensification, and what physical processes cause rapid intensification events as described in Rauber's hurricane chapters?
- Drawing on Jim Reed's storm-chasing accounts, how does real-world field observation complement or challenge the theoretical models presented in Rauber — what does being 'in the field' reveal that instruments alone cannot?
- Compare and contrast the formation mechanisms of a nor'easter and a lake-effect snowstorm, referencing the synoptic and mesoscale conditions Rauber outlines.
- How do meteorologists communicate uncertainty in severe weather forecasts, and what are the consequences — social and physical — when warnings are misunderstood or ignored?
- Radar analysis drill: Download archived Level-II Doppler radar data (e.g., from NOAA's NCDC) for a historic tornado outbreak (such as April 27, 2011) and identify hook echoes, bounded weak echo regions (BWERs), and mesocyclone signatures using Rauber's radar chapters as your guide.
- Skew-T interpretation: Obtain a real upper-air sounding from the University of Wyoming's online archive for a day preceding a severe weather event; calculate CAPE, CIN, and lifting condensation level (LCL) by hand, then verify with a sounding analysis tool.
- Storm-track mapping project: Using Jim Reed's accounts of specific chase events, plot the storm tracks on a topographic map, annotate the environmental conditions he describes, and compare them to the synoptic weather maps for those dates from archived NWS data.
- Write a 'dual-perspective' case study: Choose one documented severe weather event (e.g., a major tornado or hurricane landfall), analyze it first through Rauber's scientific framework (dynamics, thermodynamics, radar signatures) and then through Reed's observational/photographic lens — synthesize what each perspective adds.
- Warning communication exercise: Draft two public severe weather warnings for the same hypothetical tornado event — one targeting a general public audience and one targeting emergency managers — applying Rauber's discussion of watch/warning lead times and uncertainty communication.
- Field observation log: On the next 3–5 days with significant cloud activity or precipitation in your area, keep a detailed meteorological journal (cloud types, estimated storm motion, pressure trends, precipitation type) modeled on the observational discipline demonstrated by Jim Reed, then cross-reference your notes with that day's NWS storm reports.
Next up: By mastering the physical mechanisms, forecasting tools, and field-observation mindset behind the full spectrum of severe weather, the reader is now equipped to engage with climate science and long-term atmospheric change — understanding how a warming planet may shift the frequency, intensity, and geography of the very storms studied here.

A rigorous, university-level treatment of every major severe weather type; it synthesizes everything from the earlier stages — thermodynamics, fronts, upper-air patterns — and shows how they combine to produce dangerous storms.

Provides vivid real-world context for the science of extreme weather, showing how professional storm observers think and operate in the field — a motivating capstone that connects scientific understanding to lived experience.
Discussion
Keep reading
Paths that share books, cover the same subject, or open a related topic.