The Best Oracle Database Administration Books
This curriculum takes an intermediate learner from solid SQL and PL/SQL fundamentals through Oracle-specific architecture, scripting, and performance tuning, and finally into professional DBA certification territory. Each stage builds the vocabulary and mental models required for the next, ensuring no conceptual gaps as complexity increases.
Oracle SQL Mastery
IntermediateGain deep, Oracle-specific SQL fluency — including advanced queries, analytic functions, and the optimizer — so that every later topic (PL/SQL, tuning, administration) has a rock-solid query foundation.
▸ Study plan for this stage
Pace: 8–10 weeks, ~40–50 pages/day (including active practice). Allocate 4–5 weeks to "Oracle SQL Tuning with Oracle SQLTXPLAIN" (deeper dives into execution plans and tuning mechanics), then 4–5 weeks to "Expert Oracle SQL" (advanced query patterns and optimizer internals).
- Execution plans: how to read, interpret, and predict Oracle's query execution strategy using EXPLAIN PLAN and SQLTXPLAIN
- Optimizer fundamentals: cost-based optimizer (CBO), statistics, cardinality estimation, and join order selection
- Analytic functions (window functions): ROW_NUMBER, RANK, DENSE_RANK, LAG, LEAD, aggregate window functions, and partitioning logic
- Advanced join techniques: hash joins, nested-loop joins, sort-merge joins, and when Oracle chooses each
- Subqueries and inline views: scalar subqueries, correlated subqueries, WITH clauses (CTEs), and their performance implications
- Index behavior and access paths: index range scans, full table scans, index skip scans, and how to influence optimizer decisions
- SQL transformation and rewriting: how Oracle rewrites queries internally, predicate pushdown, and query optimization techniques
- Tuning methodology: systematic approach to identifying bottlenecks, using SQLTXPLAIN output, and validating improvements
- How do you read and interpret an Oracle execution plan, and what do metrics like COST, ROWS, and BYTES tell you about query performance?
- Explain the difference between a nested-loop join, hash join, and sort-merge join; when does Oracle choose each, and how do statistics influence that choice?
- What are analytic functions, and how do ROW_NUMBER, RANK, LAG, and aggregate window functions differ in their behavior and use cases?
- How does the cost-based optimizer estimate cardinality, and what role do table/index statistics play in that estimation?
- When should you use a correlated subquery versus an inline view or WITH clause, and what are the performance trade-offs?
- How do you use SQLTXPLAIN to diagnose a slow query, and what steps would you take to rewrite it for better performance?
- Run EXPLAIN PLAN on 10 different queries (simple selects, joins, subqueries, analytic functions) and interpret each execution plan; document the COST, ROWS, and access paths for each step.
- Use SQLTXPLAIN to analyze a slow query from a real or sample Oracle database; identify the bottleneck (poor cardinality estimate, inefficient join order, missing index) and propose a rewrite or index change.
- Write 5 queries using different analytic functions (ROW_NUMBER, RANK, LAG, SUM OVER, COUNT OVER) on a sample dataset; compare their output and understand partitioning and ordering.
- Create a query with a correlated subquery, rewrite it as an inline view and as a WITH clause, run EXPLAIN PLAN on all three, and document which is fastest and why.
- Build a complex multi-table join (4+ tables) with multiple filter conditions; experiment with different join orders and predicates, observe how the optimizer changes the plan, and tune it to minimize cost.
- Gather statistics on a test table, run a query, then invalidate/modify statistics and re-run the same query; observe how cardinality estimates and execution plans change.
Next up: Mastery of Oracle SQL execution, optimization, and the cost-based optimizer provides the performance-tuning mindset and diagnostic skills essential for PL/SQL development, instance tuning, and advanced administration — you will now be able to write and debug efficient code and understand system-level bottlenecks.

Bridges general SQL knowledge to Oracle-specific query execution and explains how the Cost-Based Optimizer works — essential context before diving into PL/SQL or DBA tasks.

Deepens understanding of Oracle SQL internals, execution plans, and optimizer behaviour; reading this second cements the analytical thinking needed for everything that follows.
PL/SQL Programming
IntermediateWrite robust, efficient PL/SQL code — procedures, functions, packages, triggers, and error handling — and understand how server-side code interacts with the Oracle engine.
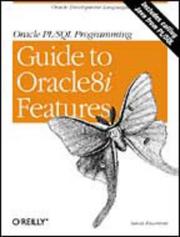
The definitive PL/SQL reference; its logical progression from language basics to packages and performance makes it the natural first read in this stage.

Read immediately after the main reference to internalize coding standards and anti-patterns before writing production-grade code or preparing for certification.
Oracle Database Architecture & Core DBA Skills
IntermediateUnderstand Oracle's internal architecture (memory, processes, storage, redo, undo), perform day-to-day DBA tasks, and manage backup and recovery confidently.
▸ Study plan for this stage
Pace: 8–10 weeks, ~40–50 pages/day (with hands-on lab time)
- Oracle instance architecture: SGA (System Global Area), PGA (Program Global Area), background processes, and how they interact
- Memory management: buffer cache, redo log buffer, shared pool, and tuning parameters (db_buffer_cache_size, sga_target, etc.)
- Storage structures: tablespaces, datafiles, segments, extents, blocks, and the relationship between logical and physical storage
- Redo and undo mechanisms: how redo logs ensure durability, undo segments support rollback, and the role of ACID compliance
- Database startup and shutdown: initialization parameters, control files, data dictionary, and the different startup modes
- Backup and recovery strategies: full backups, incremental backups, RMAN, point-in-time recovery, and disaster recovery planning
- Day-to-day DBA tasks: user management, privilege administration, monitoring performance, managing space, and troubleshooting common issues
- Architectural best practices from Kyte: understanding how Oracle works internally to write better SQL, design better schemas, and make informed tuning decisions
- Explain the difference between the SGA and PGA, and describe what major components reside in each. How do they scale with database load?
- Walk through a complete database startup sequence from initialization parameter reading through opening the database. What happens at each stage?
- How do redo logs and undo segments work together to ensure data consistency and support recovery? What happens if undo tablespace fills up?
- Design a backup and recovery strategy for a production database, including full backups, incremental backups, and RMAN configuration. How would you perform point-in-time recovery?
- Given a performance problem (slow queries, high CPU, memory pressure), what diagnostic views and tools would you use to identify the root cause?
- Explain how Oracle's internal architecture (buffer cache, redo log buffer, undo segments) influences SQL execution and query optimization decisions.
- Set up a test Oracle 12c database from scratch; configure initialization parameters (sga_target, db_recovery_file_dest, undo_tablespace) and document the startup sequence.
- Use V$ views (V$SGA, V$SGASTAT, V$PROCESS, V$SESSION) to monitor memory usage and active sessions; identify which components are consuming the most memory.
- Create and manage tablespaces and datafiles; perform space monitoring using DBA_TABLESPACES, DBA_DATA_FILES, and DBA_FREE_SPACE; practice adding datafiles and resizing them.
- Configure RMAN, perform full and incremental backups, and practice point-in-time recovery on a test database; document the backup strategy and recovery procedures.
- Simulate a failure scenario (e.g., loss of a datafile, redo log corruption) and perform recovery using RMAN; verify data integrity post-recovery.
- Create users, grant privileges (system and object), and audit user activity; practice role-based access control and least-privilege principles.
- Analyze a slow-running query using execution plans, wait events (V$SESSION_WAIT, V$SYSTEM_EVENT), and AWR reports; identify bottlenecks and propose tuning strategies based on architectural understanding.
- Read and annotate key chapters from Kyte's book on how Oracle works internally; create a reference guide linking architectural concepts to SQL tuning and design decisions.
Next up: This stage equips you with deep architectural knowledge and hands-on DBA competency, preparing you to move into advanced topics such as performance tuning, high availability (RAC, Data Guard), and specialized workload optimization.
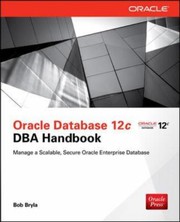
A comprehensive, task-oriented DBA handbook that covers installation, storage, security, and backup/recovery — the best single starting point for core administration duties.
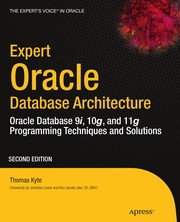
Tom Kyte's deep dive into how Oracle actually works internally; reading this after the handbook transforms a task-executor into a true architect who understands the 'why' behind every DBA decision.
Performance Tuning
ExpertDiagnose and resolve performance bottlenecks at every layer — SQL, memory, I/O, contention, and wait events — using Oracle's built-in diagnostic tools (AWR, ASH, ADDM, SQL Tuning Advisor).
▸ Study plan for this stage
Pace: 6–8 weeks, ~40–50 pages/day (mix of dense technical content and hands-on lab work)
- Wait event analysis and the Method R approach: understanding that response time = CPU + wait time, and using wait events to pinpoint bottlenecks
- AWR (Automatic Workload Repository) reports: capturing, interpreting, and using historical performance data to identify trends and root causes
- ASH (Active Session History) and real-time diagnostics: drilling into active sessions to catch transient performance issues and understand session behavior
- ADDM (Automatic Database Diagnostic Monitor) findings and recommendations: leveraging automated analysis to prioritize performance issues by impact
- SQL Tuning Advisor and execution plans: analyzing and tuning individual SQL statements using hints, indexes, and plan optimization
- Memory tuning (SGA, PGA, buffer cache): sizing and configuring memory structures to minimize I/O and contention
- I/O subsystem analysis and optimization: identifying hot files, datafile placement, and I/O bottlenecks using v$ views and AWR metrics
- Contention and lock analysis: detecting and resolving latch contention, enqueue waits, and lock conflicts using diagnostic tools
- How do you use AWR reports to identify the top wait events in a database, and what does each major wait event category (CPU, I/O, lock, etc.) tell you about performance problems?
- Explain the Method R approach: how does breaking response time into CPU and wait time help you prioritize tuning efforts?
- What is the difference between ASH and AWR, and when would you use each tool to diagnose a performance issue?
- How do you interpret an ADDM report, and how do you decide which recommendations to implement first based on impact and effort?
- Walk through the process of tuning a slow SQL statement: how do you capture the execution plan, identify the problem, and apply a fix (hint, index, etc.)?
- How do you diagnose and resolve latch contention and enqueue waits? What v$ views and AWR metrics are most useful?
- What are the key memory structures in the SGA and PGA, and how do you size them to reduce I/O and improve performance?
- How do you identify hot datafiles and I/O bottlenecks, and what strategies can you use to redistribute I/O load?
- Generate and analyze an AWR report from a test database: identify the top 5 wait events, calculate the time spent in each, and propose tuning actions for the top 3.
- Use ASH queries to drill into active sessions during a simulated workload: capture session details, SQL text, and wait events; identify which sessions are blocking others.
- Run ADDM on a test database and review the findings report: categorize recommendations by impact and effort, and implement at least 2 high-impact recommendations.
- Capture and tune a slow SQL statement: obtain the execution plan, identify full table scans or inefficient joins, create an index or apply a hint, and measure the improvement.
- Analyze memory usage in a test database: check SGA and PGA sizes, review buffer cache hit ratio and memory pressure indicators, and adjust parameters based on AWR data.
- Identify I/O bottlenecks using v$filestat and AWR I/O metrics: find hot datafiles, calculate read/write rates, and propose a file redistribution strategy.
- Simulate and resolve a latch contention issue: use v$latch and AWR data to identify the contended latch, research the cause, and apply a fix (e.g., parameter adjustment).
- Create a performance baseline: capture AWR snapshots over a week, document key metrics (response time, wait events, throughput), and use it to measure the impact of tuning changes.
Next up: This stage equips you with the diagnostic mindset and tools to systematically identify and resolve performance issues; the next stage will likely focus on applying these skills to specific workload types (OLTP vs. data warehouse tuning) or advanced topics like parallel execution and RAC performance.

Provides a structured, methodology-driven approach to performance diagnosis; its focus on wait-event analysis and AWR/ASH makes it the ideal entry point to this stage.

Introduces Method R, the rigorous response-time-based tuning methodology used by top Oracle DBAs worldwide; reading this second reframes everything learned so far into a professional diagnostic framework.
OCP Certification & High Availability
ExpertConsolidate all prior knowledge into certification-ready mastery, including Data Guard, RAC concepts, and the advanced topics tested on the Oracle Certified Professional (OCP) exam.
▸ Study plan for this stage
Pace: 8–10 weeks, ~40–50 pages/day with lab time
- Data Guard architecture: primary, standby, and redo transport mechanisms
- Redo log shipping, log apply services, and synchronous vs. asynchronous modes
- Standby database creation, configuration, and maintenance procedures
- Role transitions: switchover and failover operations and their implications
- Data Guard broker: automated management, configuration, and monitoring
- Protection modes: maximum availability, maximum performance, and maximum protection
- Monitoring, troubleshooting, and performance tuning of Data Guard environments
- Integration of Data Guard with backup, recovery, and disaster recovery strategies
- What are the key differences between a physical standby and a logical standby database, and when would you choose each for your environment?
- Explain the complete process of creating a standby database from a primary database, including redo transport and log apply configuration.
- How do synchronous and asynchronous redo transport modes differ, and what are the trade-offs between them in terms of performance and data protection?
- What is the difference between a switchover and a failover, and what steps must you take to prepare for and execute each operation?
- How does the Data Guard broker simplify management compared to manual Data Guard configuration, and what are its key features?
- Describe the three Data Guard protection modes and explain which one you would recommend for a mission-critical production environment and why.
- Set up a physical standby database from scratch on a test system, configuring redo transport and log apply services manually.
- Configure the Data Guard broker on your primary and standby databases, then use it to perform a switchover operation.
- Simulate a primary database failure and execute a failover to the standby; document the steps and verify data consistency afterward.
- Monitor redo transport lag and log apply lag using V$ views; identify bottlenecks and adjust parameters to optimize performance.
- Create a standby database using RMAN backup and restore, then validate that it is synchronized with the primary.
- Test and document the behavior of each Data Guard protection mode (maximum availability, maximum performance, maximum protection) under load.
Next up: Mastery of Data Guard establishes the foundation for understanding Oracle Real Application Clusters (RAC) and how high availability is achieved across multiple nodes, preparing you for the final integration of all OCP-level topics.

Covers Oracle's primary high-availability and disaster-recovery solution in production depth, rounding out the curriculum with real-world HA skills expected of a senior DBA.
Discussion
Keep reading
Paths that share books, cover the same subject, or open a related topic.