Options trading: the best books to learn calls, puts, and strategy
This curriculum is built for a learner who already understands basic market mechanics and wants to move purposefully through options trading — from pricing intuition and the Greeks, through multi-leg strategies and volatility analysis, to professional-grade risk management. Each stage unlocks the vocabulary and mental models needed for the next, so the books must be read in order both within and across stages.
Calls, Puts & Pricing Intuition
IntermediateBuild a solid working model of how options are priced, what the Greeks mean in practice, and how to think about risk/reward before placing a single trade.
▸ Study plan for this stage
Pace: 8–10 weeks, ~40–50 pages/day. Start with McMillan's foundational chapters (weeks 1–4), then transition to Natenberg's deeper pricing mechanics (weeks 5–8), with 2 weeks for review, integration exercises, and Greeks mastery.
- Call and put intrinsic value, time value, and how they decompose option premiums (McMillan foundation)
- The Greeks (delta, gamma, theta, vega, rho) as practical risk measures and hedging tools, not just calculus outputs (McMillan + Natenberg)
- Volatility as the primary driver of option prices; implied vs. realized volatility and volatility skew (Natenberg core focus)
- Put-call parity and synthetic relationships—how to construct equivalent positions and spot mispricings (McMillan + Natenberg)
- Early exercise decisions for American options and dividend impact on call/put values (McMillan practical chapters)
- Binomial and Black-Scholes models as mental frameworks for pricing, not just formulas (Natenberg quantitative foundation)
- Risk/reward assessment before entry: understanding probability of profit, breakeven points, and margin requirements (McMillan strategic lens)
- Volatility term structure and smile/skew: why different strikes and expirations have different implied volatilities (Natenberg advanced)
- Explain the relationship between a call's delta and the probability it finishes in-the-money; why does delta change as the stock price moves?
- A call is trading at $3 with 30 days to expiration. How would you decompose this premium into intrinsic and time value, and what happens to each component as expiration approaches?
- Why does a long call position have positive vega (profits from rising volatility) while a short call has negative vega? How does this affect your risk if implied volatility spikes?
- Put-call parity states C − P = S − K·e^(−rT). If this relationship is violated, what arbitrage opportunity exists, and how would you execute it?
- Compare the Greeks of a deep in-the-money call vs. an at-the-money call with the same expiration. Why do their deltas, gammas, and thetas differ, and what does this mean for hedging?
- A stock is trading at $100. You sell a 100 call for $4 and buy a 100 put for $3. What is your max profit, max loss, and breakeven? How does this relate to put-call parity?
- Build a one-page Greeks reference table for calls and puts (delta, gamma, theta, vega ranges) across moneyness levels (deep ITM, ATM, deep OTM). Use McMillan's numerical examples to populate it.
- Manually calculate option prices using the binomial model (2–3 steps) for a simple stock scenario; compare your results to Black-Scholes outputs from Natenberg's examples. Document assumptions and sensitivities.
- Create 5 synthetic position diagrams: long call + short put (synthetic long), short call + long put (synthetic short), and three others from McMillan's strategic combinations. Label payoffs, Greeks, and when each is appropriate.
- Track a real or paper option for 1–2 weeks: record daily price, IV, Greeks, and decompose premium changes into delta, gamma, and theta components. Verify Natenberg's theta decay patterns.
- Solve 10 put-call parity arbitrage problems: given spot, strike, rate, dividend, and prices for calls/puts, identify mispricings and calculate risk-free profit (use Natenberg's pricing framework).
- Volatility skew exercise: plot implied volatility across strikes for a single expiration (use real market data or Natenberg's case studies). Explain why the skew exists and how it affects your Greeks estimates.
Next up: Mastering pricing intuition and the Greeks equips you to move into strategy selection and position management—knowing *why* a spread works and *how* to adjust it when the market moves.
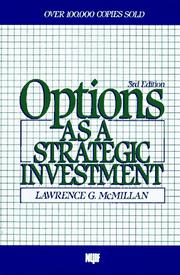
The canonical reference for serious options learners — covers calls, puts, and every major strategy with rigorous detail. Starting here ensures no conceptual gaps before moving to more specialized texts.
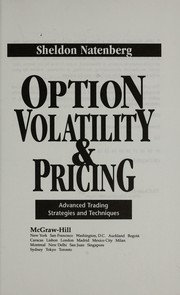
The industry standard for understanding how options are actually priced and how the Greeks interact. Reading it second lets you apply Natenberg's framework directly to the strategies McMillan introduced.
Spreads & Multi-Leg Strategies
IntermediateUnderstand how combining options into spreads controls cost, defines risk, and creates targeted directional or neutral exposures suitable for real trading.
▸ Study plan for this stage
Pace: 4–5 weeks, ~40–50 pages/day, with 2–3 days per week dedicated to strategy simulation and paper trading
- Spread mechanics: how combining long and short options creates defined risk/reward profiles and reduces net premium paid
- Vertical spreads (call spreads, put spreads): directional plays with capped profit and loss, and when to use each
- Horizontal (calendar) and diagonal spreads: time decay exploitation and volatility management across expiration dates
- Iron condors and butterflies: neutral, income-generating strategies that profit from range-bound markets and theta decay
- Greeks in multi-leg strategies: how delta, gamma, theta, and vega behave differently in spreads versus single options
- Risk management in spreads: position sizing, max loss calculation, breakeven points, and adjustment rules
- Volatility environment selection: matching spread types to implied volatility regimes (high IV for credit spreads, low IV for debit spreads)
- Real-world execution: entry/exit rules, slippage, bid-ask spreads, and practical trade management in live markets
- What is the primary advantage of a bull call spread over buying a single call option, and what trade-off does it involve?
- How do you calculate maximum profit, maximum loss, and breakeven points for a vertical spread, and why does this matter for position sizing?
- When would you choose a calendar spread over a vertical spread, and how does time decay work differently in each?
- What is an iron condor, how does it differ from a butterfly, and in what market conditions is each most profitable?
- How do the Greeks (delta, gamma, theta, vega) behave in a short call spread versus a long call spread, and how should this influence your trade selection?
- What adjustments can you make to a losing spread position, and when should you close a trade instead of adjusting?
- Map out 5 vertical spreads (bull call, bear call, bull put, bear put) for the same underlying: calculate max profit, max loss, and breakevens for each, then compare cost and risk profiles
- Build a calendar spread on a real stock: buy a 60-day call and sell a 30-day call at the same strike, track daily P&L and theta decay over 2 weeks using paper trading
- Construct and paper-trade a 30-day iron condor on a range-bound stock: set strikes 1–1.5 standard deviations from current price, monitor Greeks daily, and document how delta and theta change as expiration approaches
- Simulate a butterfly spread on 3 different stocks with varying IV levels; compare actual P&L to theoretical max profit and analyze why execution slippage occurred
- Create a decision tree: given a stock chart, implied volatility level, and market outlook, select the optimal spread type (vertical, calendar, iron condor, butterfly) and justify your choice
- Paper-trade a losing vertical spread and practice 3 adjustment techniques (rolling, closing, adding a hedge); document the outcome and lessons learned
Next up: Mastering spreads establishes the mechanical and risk-management foundation needed to layer in advanced techniques like ratio spreads, diagonal spreads, and volatility-driven strategies that exploit market dislocations and earnings events.

A clear, strategy-by-strategy breakdown of spreads and multi-leg trades that bridges theory and execution. Its visual format solidifies the payoff diagrams needed before tackling more complex structures.

Cottle's 'Coulda Woulda Shoulda' framework reframes spreads as transformations of one another, giving deep intuition for position adjustments and risk morphing that most books skip entirely.
Volatility — The Edge of Options Trading
IntermediateUnderstand implied vs. realized volatility, volatility skew, and how to use volatility analysis to find and size trades with a genuine statistical edge.
▸ Study plan for this stage
Pace: 8–10 weeks, ~40–50 pages/day (mix of reading and reworking examples). Sinclair first (4–5 weeks), then Gatheral (4–5 weeks). Plan for 2–3 review/synthesis weeks if needed.
- Implied volatility (IV) as market expectation vs. realized volatility (RV) as actual price movement; the gap between them is where edge lives
- Volatility smile and skew: why IV varies across strikes and expirations, and what it reveals about market fears and mispricing
- Mean reversion and volatility clustering: how volatility behaves statistically and why simple models fail in practice
- Volatility surface construction: the 2D landscape of IV across strikes and maturities, and how it evolves over time
- Stochastic volatility models (local vol, stochastic vol) and their role in pricing and hedging derivatives
- Trade sizing and position management using volatility forecasts: converting edge into risk-adjusted returns
- Practical arbitrage and relative value strategies: calendar spreads, dispersion trades, and volatility term structure trades
- What is the difference between implied and realized volatility, and why does the trader care about the gap between them?
- Explain volatility skew: why does IV typically differ across strikes, and what does negative skew in equity options tell you about market sentiment?
- How would you construct a volatility surface from market option prices, and what does the shape of that surface reveal about market expectations?
- Describe mean reversion in volatility: what does it mean, how do you test for it empirically, and how does it inform trade construction?
- What is the difference between local volatility and stochastic volatility models, and when would you use each for pricing or hedging?
- How do you size a volatility trade if you forecast that realized volatility will exceed implied volatility? What risk factors must you monitor?
- What is a calendar spread in volatility terms, and how does the volatility term structure inform whether it is profitable?
- Download 1 month of daily closing option prices for a liquid underlying (SPY, QQQ, or a single stock). Calculate IV for each strike and maturity using a standard model (Black–Scholes or binomial). Plot the resulting smile/skew and describe its shape.
- Compute realized volatility for the same underlying over rolling 5-, 10-, 20-, and 30-day windows. Compare it to the IV implied by options on each of those dates. Track the IV–RV spread over time and identify periods when it was most extreme.
- Build a simple volatility surface for your chosen underlying using the option data from Exercise 1. Use interpolation (e.g., cubic spline or SABR) to smooth across strikes and maturities. Visualize it in 3D or as a heatmap.
- Implement a mean-reversion test on your realized volatility time series (e.g., Augmented Dickey–Fuller test or half-life calculation). Does volatility exhibit mean reversion? What is the half-life?
- Design a calendar spread trade: identify a date when near-term IV is elevated relative to term structure. Calculate the P&L if realized volatility stays constant, increases, or decreases. What is your edge assumption?
- Simulate a simple stochastic volatility model (e.g., Heston) and compare its option prices to a constant-vol Black–Scholes model. How does the smile emerge from stochastic vol?
- Backtest a volatility trading strategy: go long realized vol (long straddle or strangle) when IV is below a rolling percentile of historical RV, and short when IV is above. Track Sharpe ratio, max drawdown, and win rate.
Next up: This stage equips you with the statistical and modeling foundations to identify and exploit volatility mispricings; the next stage will teach you how to integrate these insights into a complete trading system, including execution, risk management, and portfolio construction across multiple underlyings and strategies.

Sinclair treats volatility as a tradeable asset in its own right, covering forecasting, skew, and edge quantification. This is the essential bridge between knowing strategies and knowing when to use them.
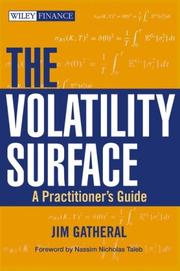
Provides a deeper, model-driven understanding of the volatility surface and skew — reading it after Sinclair gives the learner both the practical and theoretical lenses on the same phenomenon.
Disciplined Risk Management & Trading Psychology
ExpertDevelop the position-sizing rules, portfolio-level Greeks management, and psychological discipline required to survive and thrive trading options with real capital.
▸ Study plan for this stage
Pace: 8–10 weeks, ~40–50 pages/day, with 2–3 days per week dedicated to practical exercises and backtesting
- Delta, gamma, vega, theta, and rho as tools for position-sizing and portfolio hedging—not just theoretical Greeks but practical portfolio-level management
- How gamma and theta interact to create risk/reward trade-offs in multi-leg positions and portfolio construction
- Volatility management: using vega exposure to align positions with your market outlook and risk tolerance
- Position-sizing frameworks that account for Greeks exposure rather than notional contract count alone
- Technical analysis as a discipline for entry/exit timing and confluence with options Greeks—avoiding emotional decision-making
- Psychological patterns in trading (fear, greed, overconfidence) and concrete rules to enforce discipline when capital is at risk
- Portfolio-level Greeks aggregation: managing correlated positions and tail risk across multiple strikes and expirations
- The relationship between technical support/resistance levels and options Greeks-based position management for optimal risk/reward
- How would you size a short call position given a specific delta, gamma, and vega exposure target, and what portfolio-level constraints would you apply?
- Explain the gamma/theta trade-off in a short straddle: what conditions make this trade attractive from both a technical and Greeks perspective?
- How does vega exposure change your position-sizing logic, and when should you reduce vega exposure based on technical analysis signals?
- Walk through a real example: given a stock at a technical support level with elevated IV, how would you construct a position using Greeks to manage downside risk while maintaining upside exposure?
- What are three psychological biases that most commonly derail options traders, and what specific rules would you implement in your trading plan to counteract each?
- How do you aggregate Greeks across a multi-leg portfolio (e.g., 3 different spreads on correlated underlyings), and what portfolio-level limits would you set?
- Build a position-sizing spreadsheet: input delta, gamma, vega, and theta for a proposed trade, then calculate the maximum position size given your account risk limits (e.g., max 2% delta exposure, max 5% gamma exposure per 10% move)
- Analyze 5 real multi-leg options trades (from your broker history or case studies): calculate portfolio Greeks before entry, project Greeks at key technical levels, and compare actual P&L to Greeks-predicted outcomes
- Create a technical analysis + Greeks decision tree for a stock you trade: identify 3 support/resistance levels, map the IV environment at each level, then design position structures (call spreads, put spreads, straddles) with explicit Greeks targets
- Backtest a short gamma trade (e.g., short straddle) using historical data: measure realized volatility vs. implied volatility at entry, track theta decay, and quantify the impact of gamma losses on days with large moves
- Write your personal trading rules document: define position-sizing rules based on Greeks, set portfolio-level Greeks limits, and list 3–5 psychological discipline rules (e.g., 'no adding to losing positions,' 'exit rules based on technical breaks, not emotion')
- Paper-trade 10 options trades over 2 weeks: use technical analysis to time entries, Greeks to size positions, and a trading journal to log emotional triggers and how your discipline rules prevented costly mistakes
Next up: This stage equips you with the quantitative (Greeks-based position sizing) and psychological (discipline rules) foundations to manage real capital safely; the next stage will likely focus on advanced strategies (volatility arbitrage, earnings plays, or portfolio construction) where these risk-management principles become the guardrails enabling you to scale complexity and profit potential.

Focuses specifically on managing Greeks dynamically across a live portfolio — the natural capstone to the pricing and strategy stages, now applied to ongoing risk management.

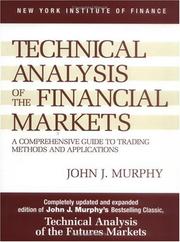
Grounds options trade selection in disciplined, statistically honest market analysis and risk frameworks, helping the learner avoid the cognitive biases that destroy options accounts.
Discussion
Keep reading
Paths that share books, cover the same subject, or open a related topic.