R can feel strange to programmers arriving from general-purpose languages — vectorized operations, an unusual assignment operator, and a design centered entirely on data. But that focus is its strength, and reading R in the order of an actual analysis workflow makes the language's choices feel obvious.
The path mirrors how analysts actually work: learn the language and its data structures, get comfortable importing and cleaning messy data, learn to visualize it, and then move into modeling and reproducible reporting. Follow that arc and R becomes the most direct tool for turning raw data into insight.
Learn the language
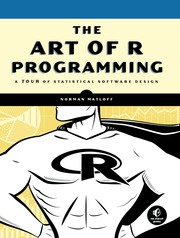
Start with Hands-On Programming with R: Write Your Own Functions and Simulations, a gentle, project-based introduction that teaches programming through small, concrete tasks. For a deeper look at how R actually works — its object systems, vectorization, and quirks — The art of R programming fills in the language mechanics that most data-focused books skip.
Wrangle and visualize
The heart of the modern R workflow is the tidyverse, and R for Data Science is its definitive on-ramp, walking you from import through tidying, transformation, and communication. Deepen the cleaning skills with Data Wrangling with R, then turn to visualization: ggplot2: Elegant Graphics for Data Analysis teaches the grammar-of-graphics system that makes R plots so expressive, and Fundamentals of Data Visualization teaches the design principles that make those plots honest and clear.
Model and report
With data in shape, move to analysis. Statistical Inference Via Data Science teaches statistics the modern way, using simulation and tidyverse tools rather than dense formulas, and Tidy Modeling with R introduces a consistent framework for building and comparing predictive models. Finally, R Markdown ties it together, showing how to weave code, results, and prose into reproducible reports and documents — the deliverable that makes your analysis useful to others.
Read in this order and R stops feeling like an odd programming language and starts feeling like a purpose-built instrument for data. Follow the full path from your first vector to a reproducible, well-visualized analysis.
Follow the full reading path →
Ready to learn something deeply?
Build a reading path — free