Learn R for data analysis: an ordered path from basics to statistics
This curriculum takes you from zero R knowledge to confident data analysis and communication across four progressive stages. You'll first build a solid foundation in R syntax and data structures, then master the tidyverse ecosystem for data wrangling, move into professional-grade visualization, and finally develop statistical modeling skills — each stage building directly on the vocabulary and tools of the last.
Foundations: R Syntax & Data Structures
BeginnerUnderstand R's core syntax, data types, vectors, data frames, functions, and control flow well enough to write and read basic R scripts confidently.
▸ Study plan for this stage
Pace: 6–8 weeks, ~40–50 pages/day (Hands-On Programming: weeks 1–3; The Art of R Programming: weeks 4–8)
- R's basic syntax: assignment, operators, comments, and command structure
- Data types and atomic vectors: numeric, character, logical, and type coercion rules
- Vector operations and recycling: element-wise operations and implicit broadcasting
- Lists and data frames: multi-type containers and tabular data manipulation
- Functions: definition, arguments, return values, and scoping (environments)
- Control flow: if/else statements, for/while loops, and vectorized alternatives
- Indexing and subsetting: bracket notation, logical indexing, and named access
- Basic debugging and code organization: reading error messages and writing readable scripts
- What are R's atomic data types, and how does type coercion work when you combine different types in a vector?
- Explain vector recycling with an example: what happens when you add a length-3 vector to a length-2 vector?
- How do data frames differ from lists, and when would you use each?
- Write a function that takes a vector as input, applies a condition, and returns a filtered result—what are the key components?
- What is an environment in R, and how does function scoping affect variable lookup?
- How would you subset a data frame to extract rows where a column meets a condition, and what are at least two ways to do it?
- Work through all exercises in Hands-On Programming chapters 1–5 (especially the dice-rolling simulation and function-writing tasks)
- Create a vector of 10 numbers, then write code to extract all values greater than the median using logical indexing
- Build a data frame from scratch with at least 3 columns (e.g., names, ages, scores) and practice subsetting by row and column using bracket notation and $
- Write a function that calculates summary statistics (mean, median, SD) for a numeric vector; test it with different inputs and verify the output
- Replicate the examples from The Art of R Programming chapters 2–4 (vectors, lists, data frames) in your own R session and modify them to deepen understanding
- Write a for loop that iterates over a list of data frames and applies a simple transformation (e.g., scaling a column); then rewrite it using a vectorized approach (lapply or sapply) and compare
Next up: This stage equips you with fluency in R's foundational building blocks—data structures, functions, and control flow—so you can move into data manipulation and analysis workflows (dplyr, tidyr, ggplot2) without stumbling over syntax or misunderstanding how R evaluates code.

The friendliest entry point into R — teaches the language through hands-on projects (dice, card games) so you build intuition for objects, functions, and environments before touching real data.
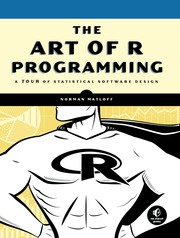
Deepens your understanding of R as a language: vectors, matrices, lists, and data frames are explained rigorously, giving you the mental model needed for everything that follows.
The Tidyverse: Wrangling & Transforming Data
BeginnerUse the tidyverse (dplyr, tidyr, readr, purrr) to import, clean, reshape, and summarize real-world datasets fluently.
▸ Study plan for this stage
Pace: 8–10 weeks, ~40–50 pages/day (R for Data Science: chapters 5–9; Data Wrangling with R: chapters 3–7)
- The grammar of data manipulation: select, filter, mutate, arrange, and summarize verbs in dplyr
- Piping workflows with %>% to chain operations cleanly and readably
- Reshaping data between wide and long formats using tidyr (pivot_longer, pivot_wider, separate, unite)
- Importing and parsing diverse data formats (CSV, Excel, JSON) with readr and handling parsing issues
- Grouped operations and window functions to compute summaries and transformations by group
- Working with strings, factors, and dates using tidyverse-aligned tools for real-world messy data
- Functional programming with purrr: map functions to iterate over lists and dataframes efficiently
- Combining datasets: joins (left, right, inner, full) and binding rows/columns with dplyr
- How do you use the core dplyr verbs (select, filter, mutate, arrange, summarize) to answer a specific question about a dataset, and how does the pipe operator chain them together?
- What is the difference between wide and long data formats, and when would you use pivot_longer vs. pivot_wider to reshape a dataset?
- How do you import a messy CSV file with readr, diagnose parsing problems, and clean the data using tidyr functions like separate or unite?
- Explain grouped operations: how do you compute group-wise summaries and add group-level calculations back to your original data?
- What are the four types of joins (left, right, inner, full), and how do you choose the right one when combining two datasets?
- How do you use purrr's map functions to apply a function to every element of a list or every column of a dataframe, and when is this preferable to a loop?
- Import a real-world CSV dataset (e.g., from Kaggle or your domain) using readr::read_csv, identify parsing issues, and fix them with appropriate column specifications
- Take a messy dataset and use dplyr verbs in a pipe chain to filter rows, select columns, create new variables with mutate, and compute summaries by group
- Reshape a dataset from wide to long format (or vice versa) using tidyr::pivot_longer or pivot_wider; explain why the new format better suits your analysis
- Use tidyr::separate and unite to split or combine columns; practice with real messy data like dates, names, or concatenated values
- Perform a multi-table join (left_join, inner_join) to combine two related datasets; verify the join worked correctly by checking row counts and key columns
- Write a purrr::map function to apply a transformation (e.g., scaling, log transformation) to multiple numeric columns in a dataframe without a loop
Next up: Mastering tidyverse data wrangling equips you to prepare clean, analysis-ready datasets, which is the foundation for exploratory data analysis, visualization, and statistical modeling in the next stage.

The canonical tidyverse textbook — covers the full data science workflow (import → tidy → transform → model → communicate) and is the single most important book on this list.

Fills in practical gaps left by R for Data Science, with focused chapters on string manipulation, dates, and complex reshaping tasks you'll encounter in real projects.
Visualization: Communicating with Data
IntermediateBuild publication-quality, expressive graphics with ggplot2 and understand the principles behind effective data visualization.
▸ Study plan for this stage
Pace: 4–5 weeks, ~25–30 pages/day, with 2–3 days per week dedicated to hands-on visualization projects
- Principles of effective data visualization: choosing the right plot type for your data and audience
- Color theory and perception: using color to encode information accurately and accessibly
- Coordinate systems and scales: understanding how axes and transformations affect data interpretation
- Gestalt principles and visual hierarchy: grouping, alignment, and emphasis to guide reader attention
- Handling uncertainty and multivariate data: visualizing confidence intervals, distributions, and relationships across multiple dimensions
- Typography and annotations: labeling, legends, and captions that clarify rather than clutter
- Common visualization pitfalls: misleading axes, inappropriate chart types, and cognitive overload
- How do you choose between a bar chart, line plot, scatter plot, and other common chart types for a given dataset and research question?
- What are the key principles of color perception, and how do you design color palettes that are both effective and accessible to colorblind readers?
- How do coordinate systems and scale transformations (linear, log, etc.) affect how viewers interpret data, and when should you use each?
- What are Gestalt principles, and how can you apply them to create visual hierarchy and guide attention in a plot?
- How do you effectively visualize uncertainty, distributions, and relationships in multivariate datasets without overwhelming the viewer?
- What role do typography, legends, and annotations play in making a visualization clear and self-explanatory?
- Recreate 5–10 visualizations from 'Fundamentals of Data Visualization' in ggplot2, paying attention to color, scales, and annotations
- Critique 3–5 real-world visualizations (from news articles, reports, or papers) using Wilke's principles; identify what works and what could be improved
- Create a multi-panel visualization showing the same dataset with different coordinate systems, color schemes, or chart types; explain how each choice affects interpretation
- Design and build a publication-quality figure for a dataset of your choice that incorporates uncertainty visualization, clear labeling, and accessible color choices
- Experiment with color palettes: create the same plot with 3–4 different color schemes and evaluate which is most effective for different audiences (including colorblind viewers)
- Build a visualization that tells a story across multiple related plots (small multiples or faceted plots) with consistent design and clear narrative flow
Next up: This stage equips you with the conceptual and practical foundation to design effective visualizations; the next stage will deepen your technical mastery of ggplot2's grammar of graphics and teach you to build complex, customized plots programmatically.

A principle-first companion to ggplot2 that teaches when and why to use each chart type, sharpening your design judgment alongside your technical skills.
Statistical Modeling & Advanced Analysis
ExpertFit, interpret, and communicate statistical models in R — from linear regression to machine learning workflows — and produce reproducible analytical reports.
▸ Study plan for this stage
Pace: 12–14 weeks, ~40–50 pages/day (with 2–3 days/week for hands-on exercises and projects)
- Statistical inference fundamentals: hypothesis testing, confidence intervals, and p-values through simulation and resampling (via Statistical Inference Via Data Science)
- Tidy data principles and their role in reproducible statistical workflows (via Statistical Inference Via Data Science and Tidy Modeling with R)
- The tidymodels framework: recipes, workflows, and model specifications for consistent, scalable modeling pipelines (via Tidy Modeling with R)
- Model fitting, evaluation, and comparison: train/test splits, cross-validation, performance metrics, and hyperparameter tuning (via Tidy Modeling with R)
- R Markdown fundamentals: dynamic document generation, code chunks, inline R, and output formats for reproducible reports (via R Markdown)
- Communicating statistical results: embedding analyses, visualizations, and interpretations in professional reports (via R Markdown and Statistical Inference Via Data Science)
- Practical machine learning workflows: from exploratory data analysis through model deployment, with emphasis on reproducibility (via Tidy Modeling with R and R Markdown)
- Best practices for literate programming: balancing code clarity, narrative explanation, and analytical rigor in a single document (via R Markdown)
- How do you use simulation and resampling to conduct hypothesis tests and construct confidence intervals, and why is this approach more intuitive than traditional parametric methods?
- What is the tidymodels framework, and how do recipes, workflows, and model specifications work together to create reproducible, maintainable modeling pipelines?
- How do you set up a proper train/test split and cross-validation scheme, and what metrics should you use to evaluate and compare different models?
- What are the key components of an R Markdown document, and how do you use code chunks, inline R, and output options to create a dynamic, reproducible report?
- How do you structure a statistical analysis report that clearly communicates findings, assumptions, and limitations to both technical and non-technical audiences?
- What are the best practices for organizing a machine learning workflow in R, from data preparation through model interpretation and reporting?
- Work through the resampling and hypothesis testing examples in Statistical Inference Via Data Science; replicate one analysis using your own dataset and document your reasoning in an R script.
- Build a complete tidymodels workflow for a regression or classification problem: create a recipe, specify a model, bundle them in a workflow, fit the model, and evaluate performance on a test set.
- Conduct a model comparison study using tidymodels: fit 3–4 different models to the same dataset, use cross-validation to evaluate them, and create a summary table of performance metrics.
- Create a multi-section R Markdown report that includes: executive summary, exploratory data analysis with visualizations, model fitting and interpretation, and conclusions with caveats.
- Write an R Markdown document that embeds a complete statistical inference analysis (hypothesis test or confidence interval) with narrative explanation, code, and inline results.
- Develop a reproducible machine learning case study in R Markdown: load data, perform EDA, fit and tune a model using tidymodels, and communicate results with publication-quality tables and figures.
Next up: This stage equips you with the statistical reasoning, modeling infrastructure, and communication tools needed to tackle domain-specific applications—whether that's time series forecasting, causal inference, Bayesian methods, or specialized machine learning domains—all grounded in reproducible, professional-grade R workflows.

Bridges tidy data skills and statistics using the infer and moderndive packages, making regression and hypothesis testing feel like a natural extension of the tidyverse you already know.

Introduces the tidymodels framework for building, tuning, and evaluating machine learning models in a consistent, tidy workflow — the modern standard for modeling in R.

Teaches you to weave code, results, and narrative into reproducible reports, dashboards, and presentations — the essential final skill for communicating your analyses professionally.
Discussion
Keep reading
Paths that share books, cover the same subject, or open a related topic.