Best Books to Learn Survival Analysis, in Order
Survival analysis is what you do when the outcome is a time to an event and some of your subjects have not had the event yet. That single wrinkle — censoring — breaks ordinary regression, and the field is the set of tools built to work around it. This path assumes you already have a course in probability and a working command of linear and logistic regression; it opens with two books that let you verify that rather than discover it halfway through a Cox model. From there it runs a gentle first course, then the four standard applied texts, then the places the proportional hazards assumption fails.
The regression background this field assumes
IntermediateConfirm you can build, check and interpret a regression model and reason about likelihood, so that censoring is the only new idea in the next stage.
▸ Study plan for this stage
Pace: Four to eight weeks, and it is a diagnostic rather than a course — the two books total 1,345 pages and nobody is expected to read them through. Davison runs to 738 pages of dense statistical theory; go to the likelihood chapters and the chapter on survival data specifically, and judge yourself on wh
- The likelihood function, maximum likelihood estimation, and the information matrix as the source of standard errors
- Partial likelihood as a distinct object from full likelihood, which is what makes Cox regression possible
- Generalised linear models and the link function, and where survival models do and do not fit that frame
- Restricted cubic splines for a continuous covariate, and why categorising a continuous variable throws information away
- Why stepwise variable selection invalidates the inference that follows it
- Model validation, calibration and the bootstrap-based optimism correction Harrell builds his workflow around
- The distinction between a model that predicts well and a model whose coefficients mean something
- What does a likelihood ratio test compare, and how does it differ from a Wald test in small samples?
- Why is a partial likelihood still a legitimate basis for inference when it is not a likelihood for the full data?
- What goes wrong statistically when you select variables by significance and then report the p-values from the final model?
- How would you decide how many knots to give a restricted cubic spline, and what does Harrell recommend?
- What is the difference between discrimination and calibration in a fitted model, and can a model be good at one and bad at the other?
- Work Davison's likelihood chapter exercises until you can derive the score and information for an exponential model without notes — that exponential case is the first parametric survival model you will meet
- Take a dataset you already know and refit it Harrell's way: splines for the continuous predictors, no stepwise selection, bootstrap validation, and a calibration plot
- Read Davison's chapter on survival data before touching stage two, then write down which ideas in it were new and which were regression you already had
- Reproduce one of Harrell's worked Cox examples in software, including the validation step, and compare his reported optimism to yours
- Write a half page explaining censoring to yourself in likelihood terms: what exactly does a censored observation contribute to the likelihood, and why is it not simply missing data?
Next up: You now have every tool the next stage uses except one — the contribution a censored observation makes to a likelihood — which is precisely the idea Kleinbaum and Klein spend their first chapters on.
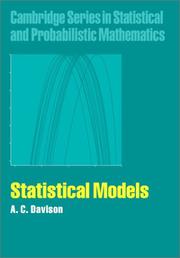
The prerequisite check, and an unusually complete one: likelihood, generalised linear models and a genuinely good chapter on survival data in a single volume. If its treatment of likelihood inference is comfortable, you are ready; if not, this is the book to work through first.

Harrell teaches the modelling craft the survival texts assume but rarely teach — splines, how not to select variables, validation, calibration — and applies it directly to Cox models. Placed here because these habits are far easier to acquire before you learn a new model class than after. The record is the current second edition.
A first course: Kaplan-Meier, log-rank, Cox
IntermediateBe able to build and read a survival curve, test two groups, fit a Cox proportional hazards model, and check the proportional hazards assumption — in software, on real data.
▸ Study plan for this stage
Pace: Two to three months, and the reading rate here is far higher than anywhere else on the path because the format does the work. Kleinbaum and Klein's 606 pages have the derivation on one side and the answer on the facing page, so they move at 25-30 pages a session even though the content is new — do n
- Right censoring, and the independence assumption that makes it ignorable
- The survival function, hazard function and cumulative hazard, and the algebra relating them
- The Kaplan-Meier estimator and Greenwood's formula for its variance
- The log-rank test as a comparison of observed and expected events, and its relation to the score test from a Cox model
- The Cox proportional hazards model and the hazard ratio as its output
- The proportional hazards assumption and the three standard ways to check it — log-log plots, Schoenfeld residuals, and a time-by-covariate interaction
- Discrete-time survival analysis as pooled logistic regression, which is Allison's route in
- Why can a Kaplan-Meier curve not reach zero when the largest observation is censored, and what should you report instead of a median in that case?
- What exactly does a hazard ratio of 1.5 mean, and why is it not a risk ratio?
- Under what circumstance does the log-rank test have poor power even though the two survival curves clearly differ?
- How would you test the proportional hazards assumption for a single covariate, and what would you do if it failed?
- How does Allison's discrete-time approach recast a survival problem as a logistic regression, and when is that the better tool?
- Compute a Kaplan-Meier estimate by hand for a small dataset of ten observations with two censored, then reproduce it in software following Moore
- Fit a Cox model to the same data, extract the Schoenfeld residuals, and plot them against time as Kleinbaum and Klein instruct
- Deliberately break proportional hazards by simulating a treatment effect that reverses partway through follow-up, then confirm your diagnostic detects it
- Take one of Allison's discrete-time examples and refit it as a Cox model, then explain in writing why the two answers differ
- Work Kleinbaum and Klein's stratified Cox chapter and fit a stratified model to a covariate that failed your proportional hazards check
Next up: You can now fit and check a Cox model; the next stage is about everything the standard references say when a Cox model is not enough — parametric alternatives, time-dependent covariates, and interval censoring.
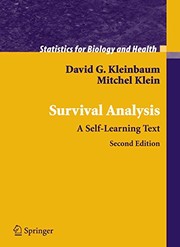
The gentlest entry in the field: Kleinbaum and Klein's page-by-page format walks you through every derivation with the answers on the facing page. Start here even if you find the format patronising. Our record is the second edition — buy the third, which adds competing risks and parametric models.

A short, current, code-first companion to Kleinbaum. Read it in parallel rather than after: the theory sticks far better when you have fitted the model, and Moore's coverage of the survival package is the practical half Kleinbaum leaves out.

The social scientist's entry point, and a useful corrective if the medical framing of the other books does not match your data. Very short, unusually clear on discrete-time methods, and the standard reference for repeated events.
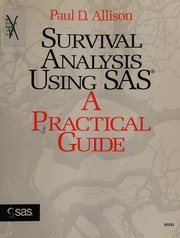
Here only if your workplace runs SAS, which much of pharma and clinical research still does. Allison's SAS book is the practical reference for PROC LIFETEST and PROC PHREG; the record is the first edition, and the second edition is the current one.
The standard applied texts
BeginnerWork fluently with parametric survival models, time-dependent covariates, stratification and interval censoring, and know which of the four standard references answers which question.
▸ Study plan for this stage
Pace: Six to nine months if you work all four, which totals 2,000 pages — but the honest advice is to read one cover to cover and use the other three as references, and Collett is the one to read. His 548 pages are the best-written in the field and repay 8-10 pages a day with the worked trials followed pr
- Parametric survival models — exponential, Weibull, log-normal, log-logistic, gamma — and the shapes of hazard they can and cannot produce
- Accelerated failure time models as an alternative parameterisation to proportional hazards
- Time-dependent covariates, and the difference between an external and an internal one
- Stratification as a way of relaxing proportional hazards without estimating the stratifying effect
- Left truncation and delayed entry, and the risk-set correction they require
- Interval censoring and why it breaks the partial likelihood
- Model checking for survival models: martingale, deviance, score and Schoenfeld residuals and what each detects
- Sample size and power calculation for a trial with a time-to-event endpoint
- When is a Weibull model preferable to a Cox model, and what do you gain and lose by making the parametric assumption?
- What is the relationship between the accelerated failure time and proportional hazards parameterisations, and for which distribution are they the same model?
- Why does including an internal time-dependent covariate make the hazard ratio hard to interpret causally?
- How does a delayed-entry design change the risk set at each event time, and what happens if you ignore it?
- Which of the four residual types would you plot to check the functional form of a continuous covariate, and why that one?
- How many events, rather than how many subjects, does a trial need to detect a given hazard ratio?
- Fit exponential, Weibull and log-normal models to the same dataset following Lee's chapters, plot the fitted hazards on one set of axes, and explain which shapes each family cannot produce
- Work one of Collett's real-trial examples end to end, including his model-checking sequence, and write down where his conclusions differ from what a naive Cox fit would have given
- Apply Hosmer and Lemeshow's purposeful selection procedure to a dataset and compare the final model with what stepwise selection would have chosen
- Look up left truncation in Klein and Moeschberger, then construct a small dataset with delayed entry and fit it twice — once correctly and once ignoring the truncation — and quantify the bias
- Do Collett's sample size calculation for a hazard ratio you care about, then check the number of events required against the number of subjects the calculation implies
Next up: Every book in this stage assumes proportional hazards holds or can be patched; the next stage is about the situations where it genuinely does not, and where the model has to change rather than the covariate.

The best-written of the standard texts and the one to read cover to cover: model checking, parametric alternatives to Cox, and sample size calculation, all worked on real trials. Our record is the 1994 first edition and the book has been through four — buy the current edition, the differences are substantial.
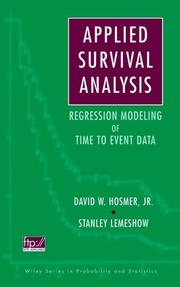
Hosmer and Lemeshow apply to survival data exactly the model-building discipline their logistic regression book made standard, which makes it the natural sequel to Harrell in stage one. The record is the first edition; the second, subtitled Regression Modeling of Time-to-Event Data, is current.
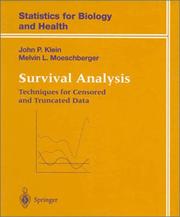
Klein and Moeschberger is the reference the others cite — the place to look up left truncation, interval censoring, or a counting-process derivation. The catalogue holds it under the bare display title Survival analysis; it is the full text, in its first edition, and the second edition is the one in print.
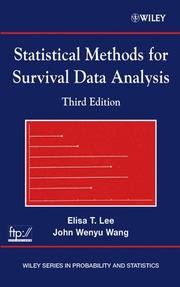
The most methodical of the four on parametric distributions — exponential, Weibull, log-normal, gamma — which the Cox-centric books skim. Included for that chapter; note that our record is the 1980 first edition and the current one is co-authored with John Wang.
Where proportional hazards fails
BeginnerRecognise when the Cox model is the wrong tool, and be able to reach for frailty models, additive hazards, multivariate survival data or a longitudinal joint model instead.
▸ Study plan for this stage
Pace: Six months to a year, and this is a research-level stage rather than a course — 2,121 pages across four books that answer four different questions. Start with Therneau and Grambsch at 357 pages: written by the author of the R survival package, it is the most useful book on the path for diagnosing a
- Martingale residuals and the counting-process formulation of survival data
- Frailty models as random effects on the hazard, and the distinction between shared and correlated frailty
- Aalen's additive hazards model, and why an additive effect is a different claim from a multiplicative one
- Time-varying coefficients as a principled response to non-proportionality rather than a patch on it
- Multivariate survival data: clustered, recurrent and competing event structures
- Joint modelling of a longitudinal biomarker and a time-to-event outcome
- Identifiability problems in frailty models, and why the frailty distribution is rarely estimable from the data alone
- What is a martingale residual, and what does its expected value tell you about the functional form of a covariate?
- When does a shared frailty model give materially different conclusions from a model that ignores clustering, and when does it not?
- Why is an additive hazards model sometimes the more natural scale for a public health question, even where a Cox model fits?
- What is the identifiability problem in univariate frailty models, and how does having clusters resolve it?
- In a joint model, what specifically goes wrong if you instead plug the longitudinal measurements into a Cox model as a time-dependent covariate?
- Which of these four books would you open first for recurrent hospital admissions, and why?
- Work Therneau and Grambsch's functional-form diagnostics on a Cox model you have already fitted, and see whether the martingale residuals reveal a nonlinearity you missed
- Fit a shared frailty model to clustered data from Hougaard's examples, then refit ignoring the cluster structure and compare both the point estimates and the standard errors
- Fit Aalen's additive model to a dataset where you have already documented a proportional hazards violation, following Martinussen and Scheike, and plot the cumulative regression functions
- Derive the martingale representation of the Nelson-Aalen estimator by hand from Martinussen and Scheike's setup, rather than reading it
- Take a longitudinal dataset, fit the mixed model from Fitzmaurice, Laird and Ware, then link it to a survival outcome as a joint model and compare against the naive time-dependent-covariate Cox fit
Next up: This is where the path ends and the journal literature begins: from here the natural continuations are competing risks and multi-state models, causal inference for time-to-event outcomes, and the Bayesian treatment of joint models.
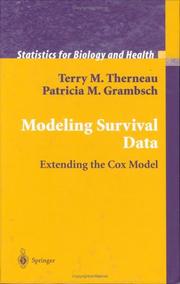
Therneau and Grambsch by the author of the R survival package: residuals, functional form, time-dependent effects and frailty, written by the person who implemented them. The single most useful book here for diagnosing a model that is quietly wrong. The record's display title is truncated to Modeling survival data.
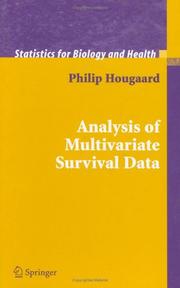
The reference for correlated failure times — paired organs, families, recurrent events — and the most complete treatment of frailty distributions anywhere. Read it when your observations are not independent, which is more often than the standard texts admit.

Martinussen and Scheike on Aalen's additive hazards model and time-varying coefficients: the principled alternative when the proportional hazards assumption fails rather than a patch on it. Mathematically the hardest book on this path — counting processes and martingales throughout.

The neighbouring field, and the last stop because joint models of longitudinal measurements and time-to-event are where current applied work sits. Fitzmaurice, Laird and Ware is the standard text for the repeated-measures half of that problem.
Discussion
Keep reading
Paths that share books, cover the same subject, or open a related topic.