Best Books to Learn Multivariate Statistics, in Order
Multivariate statistics is what you need when the variables you measured are correlated with each other and analysing them one at a time gives the wrong answer. The literature splits sharply into two traditions that rarely cite each other: applied books written for social scientists and biologists around software, and matrix-algebra courses written for statistics departments. This path deliberately runs the applied track first so the methods have meaning, then takes the standard graduate course, then the individual techniques in depth, and only at the end the distribution theory that justifies all of it.
Applied Entry Points
BeginnerRun PCA, factor analysis, discriminant analysis and cluster analysis on real data and know what each output means before deriving anything.
▸ Study plan for this stage
Pace: 8–10 weeks, and only one of these three is read cover to cover. Work Everitt and Hothorn's An Introduction to Applied Multivariate Analysis with R (273 pages) straight through with R open, about a chapter every three or four days. Tabachnick and Fidell's Using Multivariate Statistics (987 pages) is
- Why analysing correlated variables one at a time inflates error rates and distorts interpretation — the problem the whole field exists to solve
- The covariance and correlation matrix as the object every method in this path actually operates on
- Principal component analysis as variance decomposition, and how to read a scree plot and a loadings matrix without over-interpreting either
- Exploratory factor analysis versus PCA — different models, different assumptions, routinely conflated
- Discriminant analysis and the classification-versus-description distinction
- Cluster analysis as an algorithm that always returns groups, whether or not any exist
- Data screening as a first-class step: missingness, outliers, multicollinearity, and the multivariate normality assumption Tabachnick and Fidell test relentlessly
- Reporting standards — what actually goes in a results section, which is what Tabachnick and Fidell are best at
- For a given dataset, which method answers which question — when is PCA the right tool and when is factor analysis?
- What does a loading of 0.6 mean, and what does it not mean?
- What assumptions does MANOVA make, how do you check each one, and which are robust to violation?
- How would you detect a multivariate outlier that is unremarkable on every single variable?
- Given a discriminant function, how do you assess classification accuracy honestly rather than optimistically?
- Reproduce every worked example in Everitt and Hothorn by typing the code rather than copying it, and check that your output matches the numbers printed in the book. Where it does not, find out why — usually a package default has changed, and tracking that down is itself the lesson.
- Take one of Everitt and Hothorn's datasets and run the full Tabachnick and Fidell screening sequence on it before analysing: missingness pattern, univariate and multivariate outliers, normality, linearity, multicollinearity. Write the paragraph you would put in a paper.
- Run PCA and exploratory factor analysis on the same correlation matrix from Everitt and Hothorn and put the two loadings matrices side by side. The difference is the point that gets lost every time these two are treated as one method.
- Cluster a dataset you know has no group structure — permute the rows of a real variable — and see what k-means gives you. Keep the output; it is the honest introduction to stage three's clustering chapter.
- Write up one analysis to Tabachnick and Fidell's reporting template, tables and all, and check it against their worked example in the same chapter.
Next up: You now know what the methods do and what their output means, which is exactly the foundation needed to sit through the matrix algebra that justifies them.
Everitt and Torsten Hothorn's book is the fastest honest route in: every method is introduced with a dataset and the R code that fits it. Start here rather than with a theory text, because multivariate methods are almost impossible to understand from formulas alone.
Tabachnick and Linda Fidell's manual is the standard reference in psychology and education for a reason: it is relentlessly practical about assumptions, screening, outliers and how to report results. Read it as the companion you keep open, not cover to cover.

The business and marketing-research standard, notable for treating measurement and interpretation as seriously as estimation. Placed third because it is the least mathematical of the three and overlaps the other two — take it if your work is applied social science, skip it if it is not.
The Standard Course
IntermediateWork through the canonical graduate syllabus: multivariate normal theory, MANOVA, discriminant analysis and canonical correlation, with the matrix algebra made explicit.
▸ Study plan for this stage
Pace: 4–5 months. Johnson and Wichern's Applied Multivariate Statistical Analysis (800 pages) is the spine — about a chapter a week, working the exercises, and you should budget most of the stage for it. Rencher's Methods of Multivariate Analysis (800 pages) is not read in parallel cover to cover; use it
- The multivariate normal distribution — its density, its marginals and conditionals, and why every classical test in the field assumes it
- The Wishart distribution as the multivariate analogue of the chi-square, and where it comes from
- Hotelling's T² as the multivariate t-test, and the confidence-region geometry that goes with it
- MANOVA and the four test statistics — Wilks's lambda, Pillai's trace, Hotelling–Lawley, Roy's largest root — and when they disagree
- Discriminant analysis derived rather than described: the eigen-problem it reduces to
- Canonical correlation as the general framework several other methods are special cases of
- The spectral decomposition and the singular value decomposition as the algebraic machinery underneath PCA, factor analysis and canonical correlation alike
- Likelihood-ratio testing in the multivariate setting, and the union-intersection alternative
- Derive Hotelling's T² and state its exact null distribution. Why is the F transformation necessary?
- Why is Wilks's lambda the most commonly reported MANOVA statistic, and under what configuration of group differences does Roy's root behave very differently?
- Show that linear discriminant analysis reduces to an eigen-problem. Which matrices are involved, and what does the leading eigenvector mean?
- State the distribution of the sample covariance matrix under multivariate normality and say what fails when normality does not hold.
- How are canonical correlation, discriminant analysis and MANOVA related as special cases of one another?
- Which of the two identically-titled books on your shelf is which, and which one do you reach for on a computational question?
- Work Johnson and Wichern's exercises for the chapters on inference about a mean vector and on MANOVA, by hand where the matrices are small enough. The T² arithmetic is short and doing it once fixes the geometry permanently.
- Take one dataset from the applied stage, run its MANOVA in software, and then reproduce the same Wilks's lambda from the sums-of-squares-and-cross-products matrices yourself. Matching the software's number by hand is the moment the theory stops being decorative.
- Pick three topics — say, principal components, discriminant analysis and canonical correlation — and read Johnson and Wichern's treatment against Rencher's for each. Note where Rencher supplies a derivation the other only asserts.
- Derive the spectral decomposition of a small covariance matrix by hand, then verify that its eigenvectors are the principal component loadings your software reports for the same data.
- Use Härdle and Simar's computational chapters to redo one of Johnson and Wichern's classical analyses graphically, and note which conclusions survive the change of emphasis.
Next up: The course gives you a chapter's worth of each method; the next stage takes the four you will actually use most and gives you a book's worth of each.
Johnson and Dean Wichern's text is the most widely assigned multivariate course book in the world and the natural next step. Note that a different and also excellent book shares this exact title — this is the one with the green cover and the extensive worked exercises.

The best-written alternative to Johnson and Wichern, with fuller derivations and unusually clear treatment of MANOVA. Use it as the second voice on any topic where the first book loses you.

The identically-titled book by Härdle and Léopold Simar, and a genuinely different one: more computational, more graphical, and stronger on modern topics. Listed after the others so you can tell the two apart when buying.
The Techniques, One at a Time
IntermediateGo from a chapter's worth of understanding to a book's worth on the four methods you will actually use most.
▸ Study plan for this stage
Pace: 3–4 months for about 1,550 pages. Jolliffe's Principal Component Analysis (379 pages) first and slowly — three weeks — since almost everything else in this stage is downstream of it. Kaufman and Rousseeuw's Finding Groups in Data (342 pages) is three weeks and largely readable after stage one. Brown
- PCA done properly: scaling decisions, component retention rules and their disagreement, rotation of components, and the standard misapplications Jolliffe catalogues
- Why clustering is hard — algorithms return partitions unconditionally, so validation is the whole problem
- Partitioning around medoids and the silhouette coefficient, both of which originate in Kaufman and Rousseeuw
- Dissimilarity measures as the real modelling choice in cluster analysis, made before any algorithm runs
- The move from exploratory to confirmatory factor analysis: specifying a measurement model and testing it rather than extracting one
- Model fit indices, their conventional cut-offs, and why Brown treats those cut-offs as rules of thumb rather than thresholds
- Measurement invariance across groups, and what it means for any comparison of latent means
- Structural equation modelling as multivariate analysis making causal claims, and Kline's argument about how weak those claims usually are
- When should PCA be run on the correlation matrix rather than the covariance matrix, and what changes if you get it wrong?
- Name three ways PCA is commonly misused, as Jolliffe lays them out, and say how you would detect each in a published paper.
- What does a silhouette width of 0.3 tell you, and how does PAM differ from k-means in both objective and robustness?
- Given a confirmatory factor model that fits badly, how do you distinguish a misspecified measurement model from a genuinely multidimensional construct?
- What has to be true for a path coefficient in an SEM to support a causal claim? Which of those conditions is empirical and which is untestable from the data?
- Why must confirmatory factor analysis come before structural equation modelling rather than alongside it?
- Run Jolliffe's own worked PCA examples and reproduce his component retention decisions, then apply three different retention rules to the same data and count how many components each keeps. The spread is the argument for reading a whole book on one method.
- Take one dataset and cluster it with PAM and with k-means from Kaufman and Rousseeuw, then compute silhouette widths for both. Then repeat with a different dissimilarity measure and see how much of the structure was the metric rather than the data.
- Fit the measurement model from one of Brown's worked examples, reproduce his fit statistics exactly, then deliberately misspecify one loading and watch which indices move and which do not.
- Test measurement invariance across a grouping variable in your own data following Brown's sequence — configural, metric, scalar — and stop at the first step that fails.
- Take one published SEM in your field and, following Kline, write down every causal assumption the model makes that the data cannot test. This exercise is why his book is in the path.
Next up: Having used the methods at depth, the final stage derives the distributions and tests that all of them have been quoting.
The definitive monograph on the single most-used multivariate method, including all the ways PCA is misapplied. Read it first in this stage because almost everything else here is downstream of it.
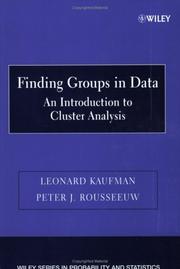
Kaufman and Peter Rousseeuw on cluster analysis, and still the clearest account of why clustering is hard: the algorithms always return groups, whether or not any exist. The source of the silhouette and PAM methods.

Where exploratory factor analysis stops and hypothesis testing on a measurement model begins. Brown is the standard bridge from the applied stage into latent-variable modelling.
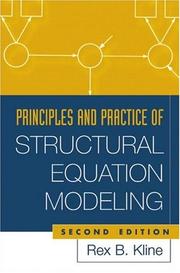
SEM is where multivariate analysis meets causal claims, and Kline is unusually forthright about how weak those claims often are. Read it after Brown — confirmatory factor analysis is the measurement half of every SEM.
The Theory
BeginnerDerive the distributions and tests the applied books quote, and read the multivariate literature without a textbook intermediary.
▸ Study plan for this stage
Pace: 4–6 months for about 1,630 pages of genuinely hard reading, and this stage assumes a real background: mathematical statistics at the level of likelihood theory, and comfort with matrix algebra as a working language rather than a notation. Mardia, Kent and Bibby's Multivariate Analysis (521 pages) is
- Multivariate normal theory derived from first principles rather than assumed: characteristic functions, marginals, conditionals, and the distribution of linear forms
- The Wishart distribution and its properties — the result Anderson establishes and everything downstream assumes
- Hotelling's T², Wilks's lambda and the union-intersection principle as consequences of that theory rather than as recipes
- Likelihood-ratio tests for covariance structure: sphericity, equality of covariance matrices, independence of sets of variables
- Asymptotic distribution theory for eigenvalues and eigenvectors of sample covariance matrices, which is what justifies every inference about principal components
- Where classical theory breaks: high-dimensional settings, where p is comparable to n and the sample covariance matrix is not well behaved
- The statistical-learning reformulation — classification, regularisation, manifold methods — as the same problems under different constraints
- How the classical multivariate literature and modern machine learning describe overlapping territory in incompatible vocabularies
- Derive the density of the Wishart distribution, or at minimum state it and derive its expectation and the distribution of a quadratic form under it.
- Prove that Hotelling's T² is the likelihood-ratio test for a mean vector, and identify where multivariate normality is actually used in the proof.
- What is the asymptotic distribution of the sample eigenvalues under multivariate normality, and what does that imply for the standard errors of PCA loadings?
- Set up the likelihood-ratio test for equality of two covariance matrices and say why it is so sensitive to non-normality.
- What specifically goes wrong with classical multivariate procedures when p approaches n, and which of Izenman's methods are responses to that?
- Take a method you learned as a recipe in stage one and state it as an estimation problem with an explicit model and loss.
- Work the derivation of the multivariate normal conditional distribution in Mardia, Kent and Bibby line by line, filling in the algebra they compress. It is the single most reused result in the field and it is worth owning.
- Derive Hotelling's T² from the likelihood ratio following Anderson, and check the result against the T² you computed by hand from Johnson and Wichern's data in stage two. The applied number and the derived distribution should meet exactly.
- Take one of the covariance-structure tests in Mardia, Kent and Bibby, implement it from the formula in R or Python, and check it against a dataset where you know the answer.
- Simulate from a multivariate normal with a known covariance matrix, compute the sample eigenvalues repeatedly, and compare their empirical distribution against the asymptotic result. Then rerun it with p close to n and watch the theory fail.
- Work Izenman's exercises for one classical chapter and one statistical-learning chapter on the same problem type — classification is the cleanest — and write down what each framework treats as the estimand.
Next up: This closes the path, with Izenman's later chapters as the deliberate bridge into the statistical-learning literature such as Hastie, Tibshirani and Friedman.
Mardia, John Kent and John Bibby — the classic British theory course, and still the most efficient statement of multivariate normal theory and the likelihood-ratio tests built on it. Compact, demanding, and the reference the other theory books argue with.

Anderson's book is the origin of most of the field's distribution theory, including the Wishart and Hotelling results everything else assumes. Read it as the primary source rather than as a course text.

The right place to end because it connects the classical material to what the same problems look like in statistical learning — classification, manifold methods, regularisation. It is the bridge from this path into machine learning texts such as Hastie, Tibshirani and Friedman.