Learn DevOps: ship software that stays up
This curriculum takes an intermediate practitioner from DevOps culture and principles through hands-on CI/CD and infrastructure-as-code practices, into the rigorous reliability engineering discipline used at scale. Each stage builds on the last: you must understand the culture before the tooling, the tooling before the systems design, and the systems design before the advanced reliability craft.
Culture & Principles
IntermediateUnderstand the organizational mindset, values, and historical context that underpin DevOps and SRE — the 'why' before the 'how'.
▸ Study plan for this stage
Pace: 10–12 weeks total: ~3–4 weeks per book. The Phoenix Project (~400 pp): read ~20 pages/day, treating it like a novel — don't rush. The DevOps Handbook (~450 pp): ~25 pages/day, pausing after each of the five parts to take notes. Accelerate (~250 pp): ~20 pages/day, reading the research chapters slowl
- The Three Ways (Flow, Feedback, Continual Learning & Experimentation) as introduced in The Phoenix Project and formalized in The DevOps Handbook — the philosophical backbone of DevOps
- The Four Types of Work (business projects, internal IT projects, changes, unplanned work) and why unplanned work is the silent killer of throughput, illustrated through Bill's journey in The Phoenix Project
- Theory of Constraints (TOC) applied to IT: identifying and exploiting the system's single bottleneck before optimizing anything else, as modeled by Brent in The Phoenix Project
- The CALMS framework (Culture, Automation, Lean, Measurement, Sharing) as the organizational lens through which The DevOps Handbook structures transformation
- The 24 Key Capabilities identified in Accelerate — spanning technical, process, and cultural dimensions — that are statistically linked to software delivery performance and organizational outcomes
- The four key metrics of software delivery performance from Accelerate: Deployment Frequency, Lead Time for Changes, Mean Time to Restore (MTTR), and Change Failure Rate — and how they separate elite from low performers
- Westrum's Organizational Culture Typology (Pathological, Bureaucratic, Generative) from Accelerate and its measurable impact on both safety and performance
- Psychological safety, blameless postmortems, and shared responsibility as cultural prerequisites — woven through all three books — without which technical practices cannot take root
- After reading The Phoenix Project, can you explain the Three Ways in your own words using a real or fictional example from your own organization — not just Bill's plant?
- The DevOps Handbook argues that small batch sizes reduce risk and accelerate flow. What is the mechanism behind this, and what organizational resistance does it typically face?
- Accelerate distinguishes between 'outcomes' and 'outputs' in measuring team performance. Why is this distinction critical, and which of the four key metrics best captures each?
- Westrum's culture model appears in Accelerate with quantitative backing. How does a generative culture specifically enable faster incident recovery, and what does the data say about the relationship between culture and MTTR?
- The Phoenix Project introduces the concept of 'technical debt' as a first-class citizen alongside financial debt. How does The DevOps Handbook recommend organizations make this debt visible and actionable to non-technical leadership?
- Across all three books, a tension exists between moving fast and maintaining stability. How do the authors collectively resolve this tension, and what evidence from Accelerate supports their resolution?
- The Phoenix Project Mirror Exercise: After finishing the novel, map your own organization (or a past one) to its characters — who is your 'Brent'? Where is your constraint? Write a one-page memo as if you were Bill on Day 1, diagnosing the top bottleneck.
- Three Ways Audit: Using The DevOps Handbook's structure, score your team or a case-study team on each of the Three Ways (1–5 scale). Write one concrete improvement action per Way, with an owner and a two-week deadline.
- Value Stream Mapping: Draw a simple value stream map for one software feature — from idea to production — in your current or a hypothetical workflow. Identify wait times, handoffs, and where unplanned work typically interrupts flow, as The DevOps Handbook prescribes.
- DORA Metrics Baseline: Using Accelerate's four key metrics as a template, collect or estimate your team's current Deployment Frequency, Lead Time, MTTR, and Change Failure Rate. Plot them against Accelerate's elite/high/medium/low performer bands and write a one-paragraph gap analysis.
- Culture Typology Self-Assessment: Using Westrum's three culture types from Accelerate, interview 3–5 colleagues with five open-ended questions about how information flows and failures are handled. Classify the team's culture and identify one specific ritual or process change that could shift it one level toward generative.
- Book Synthesis Essay: Write a 500-word essay titled 'The Why Before the How' that traces a single argument — e.g., 'culture precedes tooling' — through all three books, citing at least one specific scene, framework, or data point from each of The Phoenix Project, The DevOps Handbook, and Accelerate.
Next up: Internalizing the 'why' — the cultural values, organizational constraints, and performance science from these three books — gives you the mental model to critically evaluate and implement the technical practices (CI/CD, infrastructure as code, observability, etc.) that the next stage will cover hands-on.
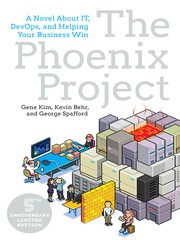
A narrative-driven introduction to DevOps thinking through a fictional IT crisis; it builds intuition for flow, feedback, and continuous learning before any technical detail is introduced.
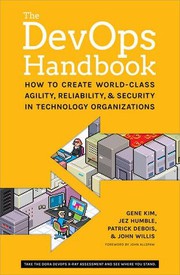
Translates the story of The Phoenix Project into concrete principles and practices — read immediately after to ground the narrative in actionable frameworks.
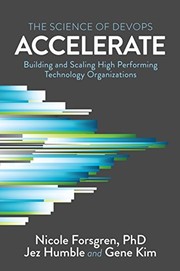
Provides the research-backed evidence for why DevOps practices improve delivery performance; establishes the key metrics (DORA) that the rest of the curriculum references.
Site Reliability Engineering Foundations
IntermediateLearn how Google operationalized reliability as an engineering discipline — SLOs, error budgets, toil reduction, and on-call culture.
▸ Study plan for this stage
Pace: 6–8 weeks, ~25–35 pages/day (the book is ~550 pages of core content); read thematically by section rather than straight through — prioritize Parts I–III in weeks 1–4, then Parts IV–V in weeks 5–8, skipping appendices on first pass
- Service Level Objectives (SLOs), Service Level Indicators (SLIs), and Service Level Agreements (SLAs) — and the critical distinctions between them
- Error budgets as a policy mechanism that balances reliability investment against feature velocity
- Toil: its precise definition (manual, repetitive, automatable, tactical, devoid of enduring value), how to measure it, and why reducing it is an engineering priority
- The SRE team structure and the 50% rule — capping operational work so engineers have time for project work
- On-call culture: escalation paths, incident command, postmortem blamelessness, and psychological safety
- Eliminating toil through automation — the progression from manual to fully autonomous systems
- Release engineering and progressive delivery as reliability levers (canarying, rollbacks, hermetic builds)
- Monitoring philosophy: symptoms vs. causes, the four golden signals (latency, traffic, errors, saturation), and alerting on SLO burn rate rather than raw metrics
- How does Google define an SLO, and why is choosing the right SLI the hardest part of setting one?
- What is an error budget, how is it calculated from an SLO, and how should a team change its behavior when the budget is nearly exhausted?
- What are the five characteristics that distinguish 'toil' from legitimate engineering work, and give a concrete example of each?
- What does the 50% rule mean in practice, and what organizational mechanisms does the SRE book describe for enforcing it?
- Walk through the anatomy of a blameless postmortem: what sections must it contain, and what makes a postmortem 'blameless' rather than merely 'blame-light'?
- What are the four golden signals, and why does the book recommend alerting on SLO burn rate rather than individual metric thresholds?
- Draft SLIs and SLOs for a real or toy service you operate (e.g., a personal API or a work microservice): write them in the exact format the book uses, justify your availability target, and calculate the resulting monthly error budget in minutes and in request count.
- Audit one week of your team's (or your own) operational work log and classify every task as toil or non-toil using the book's definition; compute the toil percentage and identify the single highest-leverage automation target.
- Run a tabletop incident simulation: pick a past outage or invent a realistic failure scenario, assign incident commander / communications lead / ops lead roles, and practice the escalation and communication cadence described in the on-call chapters.
- Write a blameless postmortem for a real or simulated incident using the structure from the book — include timeline, contributing factors, action items with owners and due dates, and an explicit 'what went well' section.
- Instrument a small application with the four golden signals using a tool you already have (Prometheus + Grafana, Datadog, CloudWatch, etc.) and create one alert that fires on SLO burn rate rather than a raw threshold.
- Map your current monitoring alerts to the 'symptom vs. cause' framework from the book: label each alert as symptom-based or cause-based, delete or demote any pure cause-based alerts that have no corresponding user impact, and document your reasoning.
Next up: Mastering Google's SRE model — its vocabulary, its error-budget policy, and its cultural norms — gives you the reliability engineering mental model needed to evaluate and adopt the broader DevOps tooling, platform engineering practices, and organizational patterns covered in subsequent stages.

The canonical SRE text; read after the DevOps culture stage so its practices land in a philosophical context rather than feeling like isolated Google-isms.
The practical companion to the SRE book with real implementation guidance and case studies from multiple companies — read second to apply what the first book taught.
CI/CD & Infrastructure as Code
IntermediateBuild hands-on competence in automating delivery pipelines and managing infrastructure programmatically and repeatably.
▸ Study plan for this stage
Pace: 6–8 weeks total: Weeks 1–4 cover "Continuous Delivery" (~25–30 pages/day, reading all parts including the deployment pipeline, configuration management, and release strategy chapters); Weeks 5–8 cover "Terraform: Up & Running" (~20–25 pages/day, working through each chapter hands-on in a real or san
- Deployment Pipeline (Continuous Delivery): the staged, automated path from commit to production — including commit stage, automated acceptance tests, and release candidates
- Configuration Management as a first-class practice: every artifact (code, config, environment definition) versioned, reproducible, and auditable
- The 'done means released' principle: distinguishing continuous integration, continuous delivery, and continuous deployment, and why the goal is always releasability
- Release strategies from Continuous Delivery: blue-green deployments, canary releases, feature toggles, and zero-downtime deploys
- Infrastructure as Code (IaC) fundamentals from Terraform: Up & Running: declarative resource definitions, state files, providers, and the plan/apply lifecycle
- Terraform modularity and reuse: writing reusable modules, input/output variables, and composing infrastructure from building blocks
- Remote state and team workflows in Terraform: backends (e.g., S3 + DynamoDB locking), workspaces, and avoiding state conflicts in collaborative environments
- Testing infrastructure code: Terratest patterns introduced in Terraform: Up & Running for validating modules before they reach production
- According to Continuous Delivery, what are the three stages of a deployment pipeline and what is the specific purpose of each stage?
- How does Continuous Delivery distinguish between a 'release candidate' and a 'release', and why does this distinction matter for pipeline design?
- What problem does Terraform's state file solve, and what risks does it introduce — and how does Terraform: Up & Running recommend mitigating those risks in a team setting?
- Compare blue-green deployments and canary releases as described in Continuous Delivery: when would you choose one over the other?
- How do Terraform modules (as taught in Terraform: Up & Running) map to the configuration management principles described in Continuous Delivery — what shared philosophy underlies both?
- What is the role of automated acceptance tests in the deployment pipeline from Continuous Delivery, and how would you provision the environment for those tests using Terraform concepts from Terraform: Up & Running?
- Pipeline skeleton build: Using any free CI platform (GitHub Actions, GitLab CI, or Jenkins), implement a three-stage pipeline (commit → acceptance → release) for a small sample app, directly mirroring the deployment pipeline model from Continuous Delivery. Each stage must gate the next.
- Feature toggle implementation: Add a simple feature toggle to the sample app from Exercise 1 and demonstrate how a new feature can be deployed to production but remain hidden — practicing the technique described in Continuous Delivery's release strategy chapters.
- Terraform 'Hello Infrastructure': Follow Terraform: Up & Running from scratch — provision a single cloud server (AWS EC2 or equivalent), then iteratively add a load balancer and an auto-scaling group, running 'terraform plan' before every 'terraform apply' and reviewing the diff each time.
- Remote state setup: Configure a Terraform S3 backend with DynamoDB state locking (as detailed in Terraform: Up & Running) for the infrastructure from Exercise 3, then simulate a concurrent apply conflict to observe the locking mechanism in action.
- Reusable module authoring: Extract the web server cluster from Exercise 3 into a standalone Terraform module with input variables and outputs, then instantiate it twice (e.g., staging and production environments) from a root module — directly applying the module patterns from Terraform: Up & Running.
- Cross-book integration exercise: Write a CI/CD pipeline (from Continuous Delivery principles) that on every merge to main: (1) runs application tests, (2) runs 'terraform plan' and posts the diff as a PR comment, and (3) on approval, runs 'terraform apply' — unifying both books into one working workflow.
Next up: Mastering automated pipelines and repeatable infrastructure provisioning creates the operational foundation needed to explore how those systems are monitored, kept reliable, and evolved safely at scale — the core concerns of Site Reliability Engineering.

The definitive text on CI/CD pipelines, deployment strategies, and release automation; establishes the vocabulary and patterns every practitioner must know.

The most widely-read practical guide to infrastructure as code with Terraform; read after Continuous Delivery so you understand *why* IaC matters before diving into the tool.
Observability & Production Systems
ExpertMaster modern observability — metrics, logs, traces, and dashboards — and understand how to reason about complex distributed systems in production.
▸ Study plan for this stage
Pace: 6–8 weeks total: Weeks 1–4 on "Observability Engineering" (~25–30 pages/day, including time to annotate and reflect); Weeks 5–8 on "Designing Distributed Systems" (~20–25 pages/day, slower pace to work through patterns hands-on). Reserve the final 2–3 days of each book for review and exercise comple
- Observability vs. monitoring: understanding why traditional metrics-and-alerts monitoring is insufficient for modern distributed systems, and how high-cardinality, high-dimensionality telemetry enables true exploratory debugging (Observability Engineering)
- The three pillars in practice — structured logs, metrics, and distributed traces — and how Charity Majors argues for moving beyond pillars toward unified event-based telemetry (Observability Engineering)
- Instrumentation as a first-class engineering discipline: embedding observability into code at write-time rather than retrofitting it, and the role of wide structured events (Observability Engineering)
- Cardinality and dimensionality: why high-cardinality fields (user IDs, request IDs, trace IDs) are the key to slicing production data and finding unknown unknowns (Observability Engineering)
- The core distributed systems patterns from Brendan Burns: single-node patterns (sidecar, ambassador, adapter), serving patterns (replicated services, sharded services), and batch computational patterns (work queues, scatter/gather, event-driven pipelines) (Designing Distributed Systems)
- Reliability and scalability trade-offs embedded in pattern selection: how each pattern in Burns affects fault tolerance, latency, and operational complexity (Designing Distributed Systems)
- The sidecar and ambassador patterns as the architectural foundation for observability infrastructure — how they enable transparent injection of logging, tracing, and metrics collection without modifying application code (both books)
- Reasoning under uncertainty in production: using SLOs, error budgets, and structured telemetry together to make confident decisions about system health rather than reacting to noisy alerts (Observability Engineering)
- After reading Observability Engineering, can you articulate the difference between 'known unknowns' (what monitoring addresses) and 'unknown unknowns' (what observability addresses), and give a concrete example from a distributed system you work with?
- How does Charity Majors define a 'wide structured event,' and why does she argue it is more powerful than emitting separate metrics, logs, and traces independently?
- What is cardinality, why does it matter for debugging production incidents, and what are the practical storage/cost trade-offs that teams must manage when indexing high-cardinality fields?
- From Designing Distributed Systems, explain the sidecar pattern: what problem does it solve, how does it relate to the ambassador and adapter patterns, and how does it enable observability tooling to be deployed independently of application code?
- Walk through the scatter/gather pattern from Burns: what class of problems does it solve, what are its failure modes, and how would you instrument it using the observability principles from Majors to detect a slow shard dragging down tail latency?
- How do SLOs and error budgets (discussed in Observability Engineering) change the conversation between development and operations teams, and how does the choice of distributed system pattern (from Burns) affect what SLIs are even measurable?
- Instrument a small service end-to-end: take any side-project or sample app, add structured wide-event logging (following Majors' guidance), emit a trace per request using OpenTelemetry, and verify you can answer 'why was this specific request slow?' without SSH-ing into the box.
- Cardinality audit: pick a production or staging system and catalog every field in your current logs/metrics. Classify each field by cardinality (low/medium/high) and identify two high-cardinality fields that are currently being dropped or aggregated away — then make the case for indexing them.
- Implement the sidecar pattern (from Burns, Chapter 2) using Docker Compose or Kubernetes: deploy a simple HTTP service with a sidecar container that scrapes its logs, enriches them with a request-ID, and ships them to a local Loki or Elasticsearch instance.
- Build a scatter/gather pipeline (Burns, batch patterns chapter) using any language and a message queue (e.g., Redis Streams or RabbitMQ), then instrument it with distributed tracing so you can visualize the full fan-out/fan-in in a Jaeger or Zipkin UI and identify the slowest worker.
- Design an SLO for a service you own or simulate: define the SLI (e.g., request success rate), set a target (e.g., 99.5% over 30 days), compute the error budget, and write a one-page runbook describing exactly which observability queries (using the wide-event model) you would run when the budget is 50% consumed.
- Failure mode mapping exercise: for three patterns from Designing Distributed Systems (e.g., replicated stateless serving, sharded data service, work queue), write a one-paragraph 'observability contract' for each — listing the minimum telemetry (metrics, traces, logs) required to detect, localize, and diagnose the most likely failure mode of that pattern.
Next up: Mastering observability and distributed system patterns equips the reader with the diagnostic vocabulary and architectural intuition needed to tackle the next stage's focus on incident management, chaos engineering, and resilience — where the question shifts from "can I see what's happening?" to "can I deliberately break things and recover gracefully?"

Reframes monitoring as observability and introduces structured events, distributed tracing, and high-cardinality debugging — the modern evolution of ops tooling.

Provides reusable patterns for building reliable distributed systems; read here to connect observability needs back to architectural decisions.
Advanced Reliability & Chaos Engineering
ExpertInternalize proactive reliability practices — chaos engineering, incident management, and building systems that survive failure gracefully at scale.
▸ Study plan for this stage
Pace: 8–10 weeks total: Weeks 1–5 cover "Chaos Engineering" by Casey Rosenthal (~25–30 pages/day, including time to re-read experiment design chapters); Weeks 6–10 cover "Database Reliability Engineering" by Laine Campbell (~20–25 pages/day, with slower pacing on storage architecture and replication chapt
- The Chaos Engineering discipline: moving from reactive firefighting to proactive, hypothesis-driven experimentation on production systems (Rosenthal)
- Steady-state hypothesis definition: establishing measurable, observable baselines before injecting failure (Rosenthal)
- Blast radius control: limiting the scope of chaos experiments to minimize customer impact while maximizing learning (Rosenthal)
- Sociological and organizational dimensions of chaos: building a culture of experimentation, psychological safety, and shared ownership of reliability (Rosenthal)
- Database reliability as a first-class SRE concern: applying SLOs, error budgets, and toil reduction specifically to data-layer systems (Campbell)
- Replication topologies and failure modes: understanding how primary/replica architectures, consensus protocols, and failover strategies affect durability and availability (Campbell)
- Operational database patterns: backup strategies, recovery time objectives (RTO), recovery point objectives (RPO), and the trade-offs between them (Campbell)
- Capacity planning and traffic management for databases: sharding, connection pooling, and graceful degradation under load (Campbell)
- How do you define and measure a steady-state hypothesis for a chaos experiment, and what makes a hypothesis falsifiable? (Rosenthal)
- What organizational and cultural prerequisites must exist before chaos experiments can be run safely in production, according to Rosenthal?
- Walk through the full lifecycle of a chaos experiment: from hypothesis formation and blast-radius scoping, through execution, to learning and remediation. (Rosenthal)
- How does Campbell frame database reliability in terms of SLOs and error budgets, and how does this differ from traditional DBA thinking?
- What are the key failure modes in primary/replica replication, and what operational runbooks should exist to handle each? (Campbell)
- How do RTO and RPO requirements drive architectural decisions around backup frequency, replication lag tolerance, and failover automation? (Campbell)
- Design a complete chaos experiment for a service you own or can simulate: write a formal steady-state hypothesis with specific metrics, define the blast radius, choose a failure injection method (latency, resource exhaustion, network partition), run or dry-run it, and write a post-experiment report documenting what you learned.
- Build a GameDay: organize a tabletop or live failure scenario with at least one other person, injecting a realistic outage (e.g., primary database failover) and practicing the full incident response loop — detection, communication, mitigation, and retrospective — drawing on both Rosenthal's experiment principles and Campbell's database failure modes.
- Map your (real or hypothetical) database architecture against Campbell's replication and failover patterns: document the current RTO/RPO, identify the top three failure scenarios, and propose concrete changes to meet a tighter SLO.
- Implement or configure a chaos tooling sandbox (e.g., Chaos Monkey, Gremlin free tier, or Pumba for containers) and run at least two experiments — one targeting compute/network and one targeting a database replica — logging results against your pre-defined steady-state metrics.
- Write a 'Reliability Risk Register' for a database-backed application: list at least eight failure modes drawn from Campbell's failure taxonomy, score each by likelihood and blast radius, and prioritize which chaos experiments to run first.
- Draft an incident runbook for a database primary failure scenario, incorporating Campbell's guidance on failover procedures and Rosenthal's principle of turning incident learnings into the next chaos experiment hypothesis.
Next up: Mastering proactive chaos experimentation and database-layer reliability creates the measurement discipline and failure intuition needed to tackle the next stage's focus on large-scale distributed systems design, where the same principles of hypothesis-driven resilience must be applied across entire service meshes and multi-region architectures.

The authoritative guide to deliberately injecting failure to surface weaknesses before they become incidents; builds directly on the SLO and observability foundations established earlier.

Applies SRE principles specifically to the data layer — often the hardest reliability challenge — rounding out the curriculum with a domain that every production system depends on.
Discussion
Keep reading
Paths that share books, cover the same subject, or open a related topic.